
- Startseite >
- Flüsse >
- Wasserstand >
- Naab - Regen >
- Langenbruck >
- Jahresgrafik

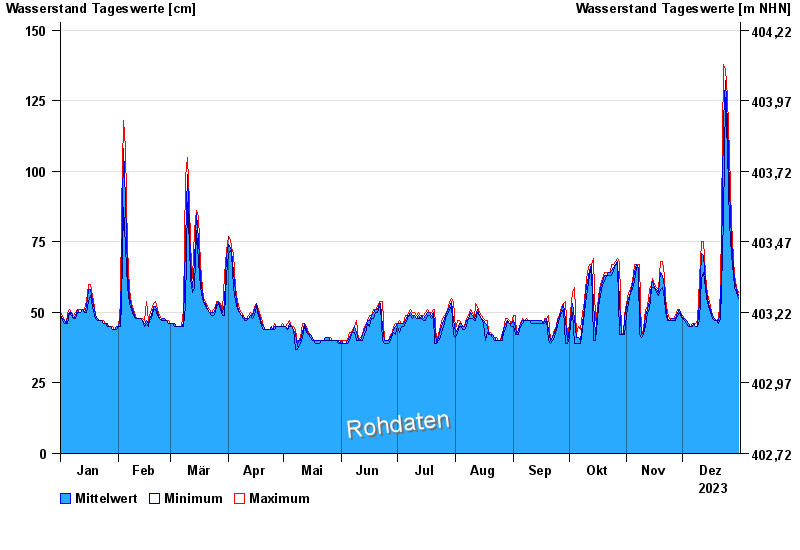
Jahresgrafik Langenbruck / Frankenohe
Wasserstand vom 01.01.2023 bis zum 31.12.2023
| Datum | Mittelwert [cm] | Maximum [cm] | Minimum [cm] |
|---|---|---|---|
| 31.12.2023 | 56 | 57 | 55 |
| 30.12.2023 | 58 | 59 | 57 |
| 29.12.2023 | 61 | 63 | 59 |
| 28.12.2023 | 66 | 69 | 63 |
| 27.12.2023 | 75 | 82 | 70 |
| 26.12.2023 | 94 | 106 | 82 |
| 25.12.2023 | 117 | 126 | 107 |
© Bayerisches Landesamt für Umwelt 2024