
- Startseite >
- Flüsse >
- Wasserstand >
- Naab - Regen >
- Langenbruck >
- Jahresgrafik

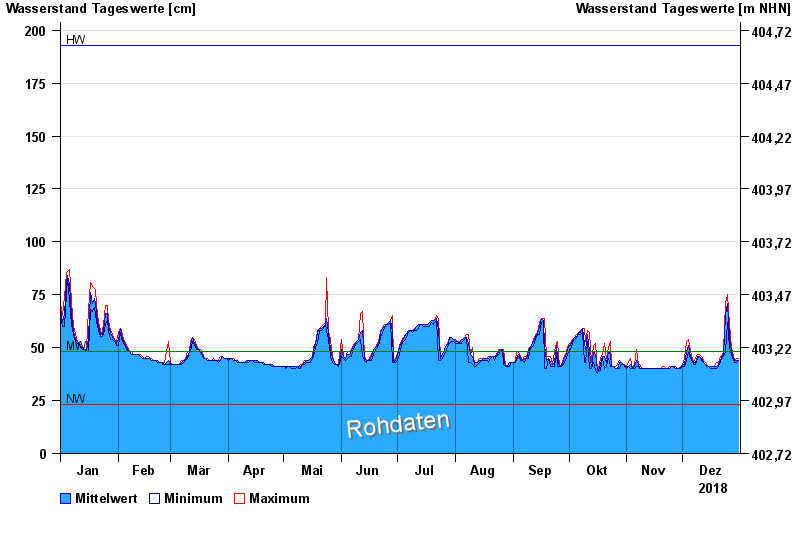
Jahresgrafik Langenbruck / Frankenohe
Wasserstand vom 01.01.2018 bis zum 31.12.2018
| Datum | Mittelwert [cm] | Maximum [cm] | Minimum [cm] |
|---|---|---|---|
| 31.12.2018 | 44 | 45 | 44 |
| 30.12.2018 | 44 | 45 | 43 |
| 29.12.2018 | 44 | 44 | 43 |
| 28.12.2018 | 45 | 46 | 44 |
| 27.12.2018 | 48 | 50 | 47 |
| 26.12.2018 | 55 | 61 | 50 |
| 25.12.2018 | 71 | 75 | 62 |
© Bayerisches Landesamt für Umwelt 2024