
- Startseite >
- Flüsse >
- Wasserstand >
- Naab - Regen >
- Langenbruck >
- Jahresgrafik

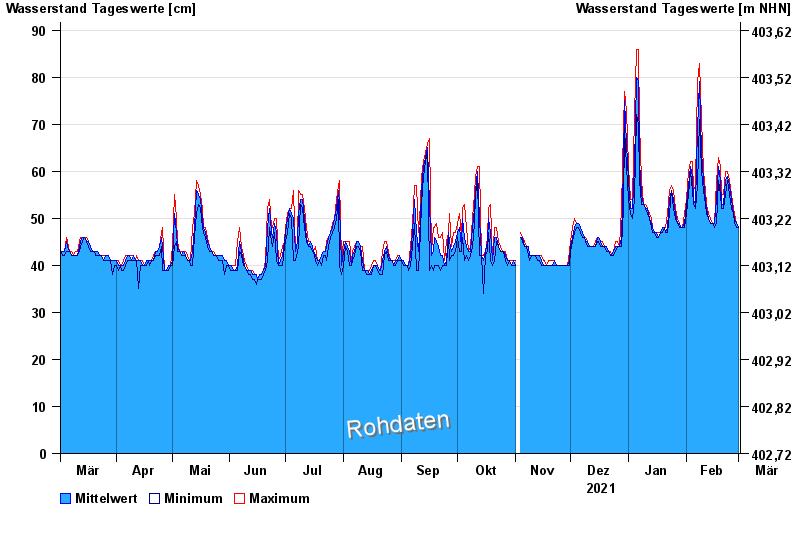
Jahresgrafik Langenbruck / Frankenohe
Wasserstand vom 02.03.2021 bis zum 01.03.2022
- 26.01.1995 Wasserstand: 193 cm
- 21.12.1993 Wasserstand: 181 cm
- 14.01.2011 Wasserstand: 176 cm
- 03.01.2003 Wasserstand: 174 cm
- 01.03.1990 Wasserstand: 172 cm
| Datum | Mittelwert [cm] | Maximum [cm] | Minimum [cm] |
|---|---|---|---|
| 01.03.2022 | 48 | 48 | 48 |
| 28.02.2022 | 49 | 49 | 48 |
| 27.02.2022 | 50 | 51 | 49 |
| 26.02.2022 | 51 | 52 | 51 |
| 25.02.2022 | 54 | 55 | 52 |
| 24.02.2022 | 57 | 58 | 55 |
| 23.02.2022 | 59 | 60 | 58 |
© Bayerisches Landesamt für Umwelt 2024