
- Startseite >
- Flüsse >
- Wasserstand >
- Naab - Regen >
- Gogl-Mühle >
- Jahresgrafik

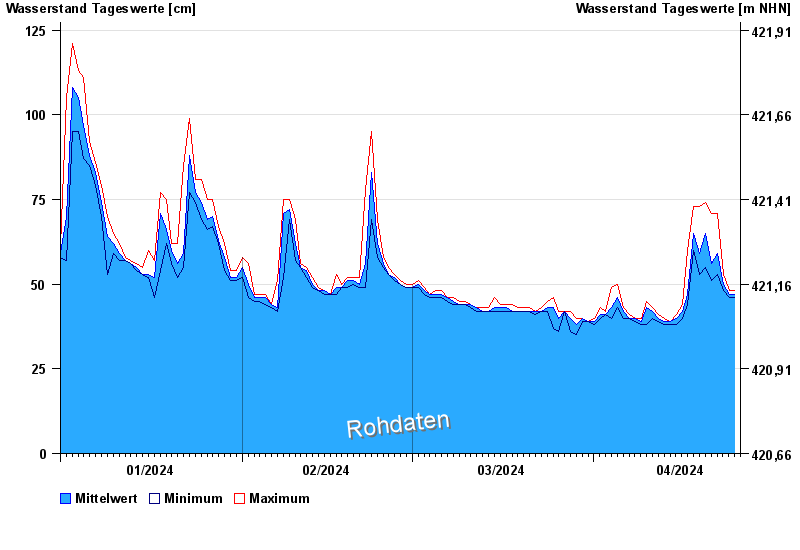
Jahresgrafik Gogl-Mühle / Chamb
Wasserstand vom 01.01.2024 bis zum 25.04.2024
 Für diesen Pegel sind keine Hochwassermarken hinterlegt.
| Datum | Mittelwert [cm] | Maximum [cm] | Minimum [cm] |
|---|---|---|---|
| 25.04.2024 | 46 | 48 | 46 |
| 24.04.2024 | 47 | 48 | 46 |
| 23.04.2024 | 50 | 53 | 48 |
| 22.04.2024 | 59 | 71 | 53 |
| 21.04.2024 | 56 | 71 | 51 |
| 20.04.2024 | 65 | 74 | 55 |
| 19.04.2024 | 59 | 73 | 53 |
© Bayerisches Landesamt für Umwelt 2024