
- Startseite >
- Flüsse >
- Wasserstand >
- Unterer Main >
- Pfarrweisach >
- Jahresgrafik

Jahresgrafik Pfarrweisach / Weisach
Wasserstand vom 29.02.2020 bis zum 28.02.2021
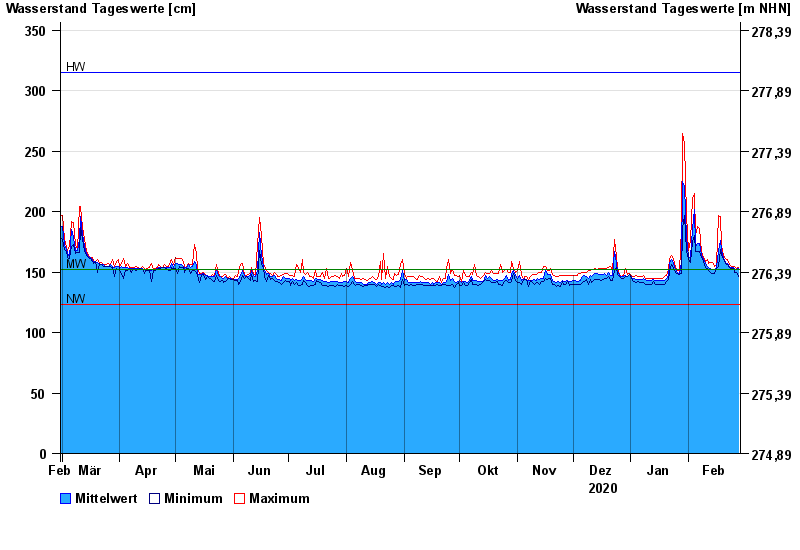
| Datum | Mittelwert [cm] | Maximum [cm] | Minimum [cm] |
|---|---|---|---|
| 28.02.2021 | 153 | 154 | 146 |
| 27.02.2021 | 152 | 153 | 150 |
| 26.02.2021 | 153 | 155 | 150 |
| 25.02.2021 | 154 | 155 | 153 |
| 24.02.2021 | 154 | 155 | 153 |
| 23.02.2021 | 155 | 156 | 154 |
| 22.02.2021 | 157 | 160 | 156 |
© Bayerisches Landesamt für Umwelt 2024