
- Startseite >
- Flüsse >
- Wasserstand >
- Unterer Main >
- Pfarrweisach >
- Jahresgrafik

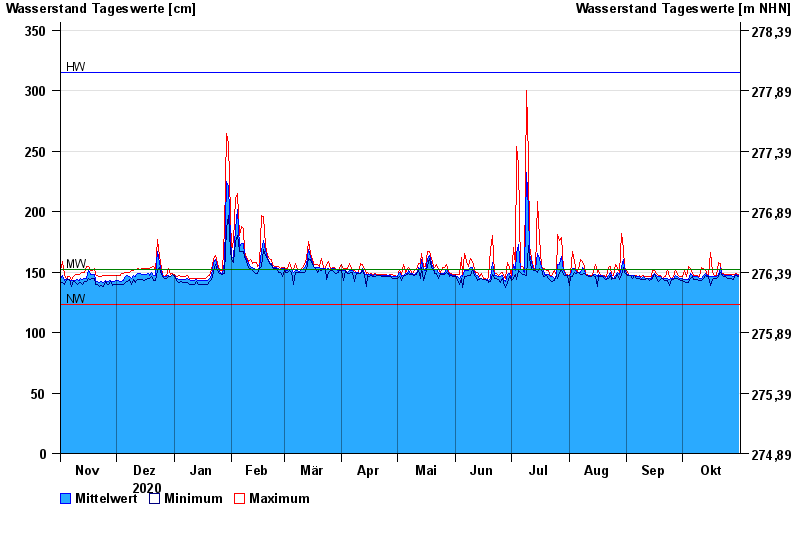
Jahresgrafik Pfarrweisach / Weisach
Wasserstand vom 01.11.2020 bis zum 31.10.2021
| Datum | Mittelwert [cm] | Maximum [cm] | Minimum [cm] |
|---|---|---|---|
| 31.10.2021 | 147 | 148 | 146 |
| 30.10.2021 | 148 | 149 | 147 |
| 29.10.2021 | 147 | 148 | 146 |
| 28.10.2021 | 146 | 148 | 144 |
| 27.10.2021 | 147 | 148 | 145 |
| 26.10.2021 | 147 | 148 | 145 |
| 25.10.2021 | 147 | 148 | 145 |
© Bayerisches Landesamt für Umwelt 2024