
- Startseite >
- Flüsse >
- Wasserstand >
- Unterer Main >
- Pfarrweisach >
- Jahresgrafik

Jahresgrafik Pfarrweisach / Weisach
Wasserstand vom 08.08.2022 bis zum 07.08.2023
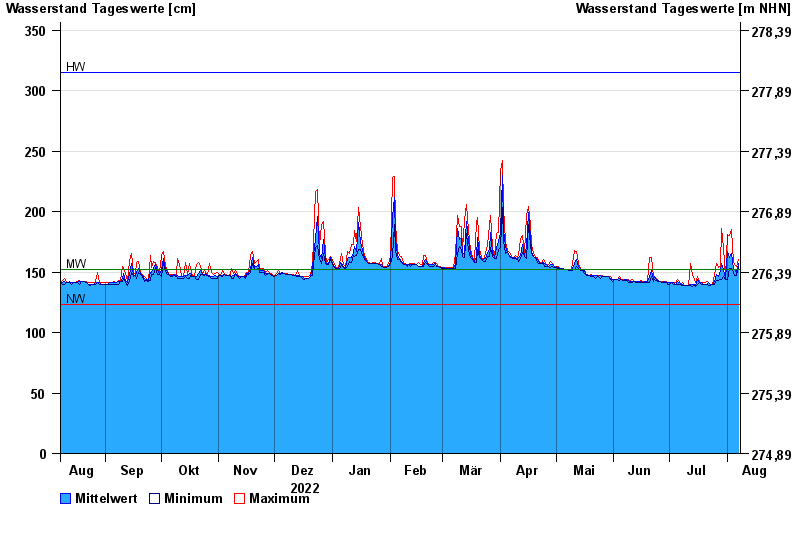
| Datum | Mittelwert [cm] | Maximum [cm] | Minimum [cm] |
|---|---|---|---|
| 07.08.2023 | 157 | 160 | 155 |
| 06.08.2023 | 150 | 155 | 147 |
| 05.08.2023 | 152 | 156 | 147 |
| 04.08.2023 | 152 | 158 | 150 |
| 03.08.2023 | 165 | 185 | 153 |
| 02.08.2023 | 162 | 180 | 153 |
| 01.08.2023 | 167 | 181 | 144 |
© Bayerisches Landesamt für Umwelt 2024