
- Startseite >
- Flüsse >
- Wasserstand >
- Unterer Main >
- Obernau >
- Monatsgrafik

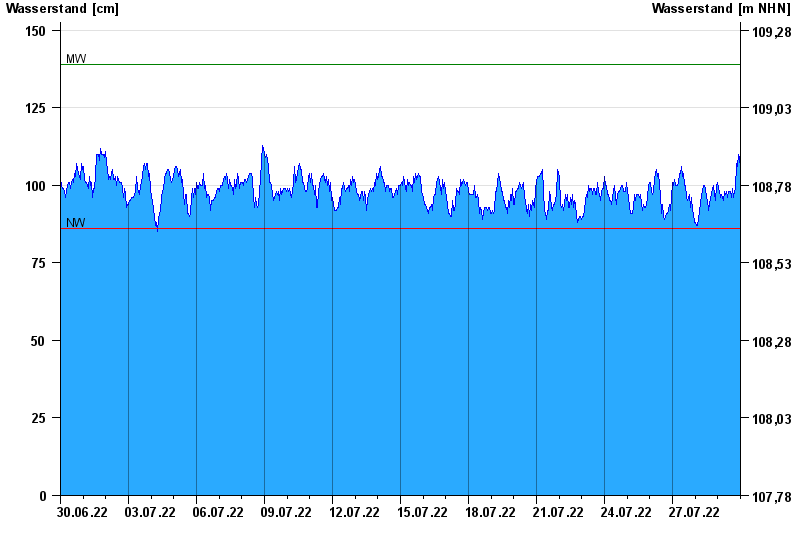
Monatsgrafik Obernau / Main
Wasserstand vom 30.06.2022 bis zum 29.07.2022
| Datum | Wasserstand [cm] |
|---|---|
| 30.07.2022 00:45 | 100 |
| 30.07.2022 00:30 | 102 |
| 30.07.2022 00:15 | 103 |
| 30.07.2022 00:00 | 103 |
| 29.07.2022 23:45 | 103 |
| 29.07.2022 23:30 | 105 |
| 29.07.2022 23:15 | 105 |
© Bayerisches Landesamt für Umwelt 2024