
- Startseite >
- Flüsse >
- Wasserstand >
- Unterer Main >
- Hafenlohr >
- Monatsgrafik

Monatsgrafik Hafenlohr / Hafenlohr
Wasserstand vom 01.04.2024 bis zum 17.04.2024
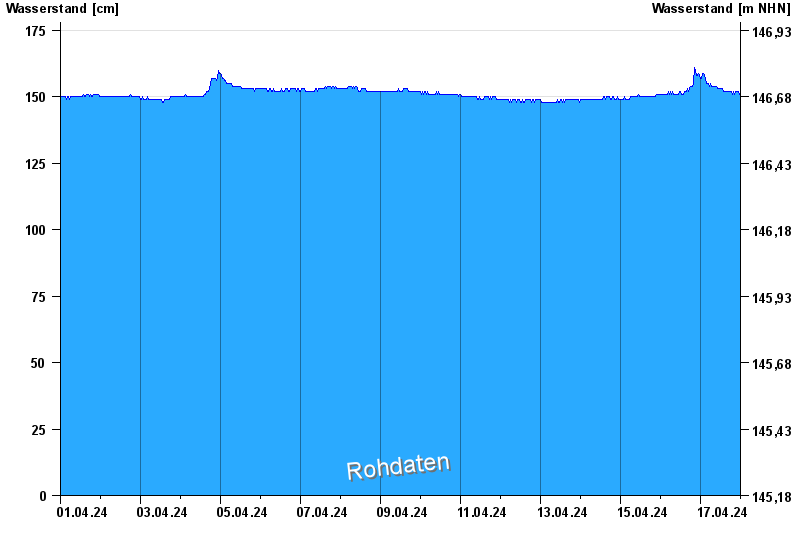
| Datum | Wasserstand [cm] |
|---|---|
| 17.04.2024 04:00 | 155 |
| 17.04.2024 03:45 | 155 |
| 17.04.2024 03:30 | 155 |
| 17.04.2024 03:15 | 156 |
| 17.04.2024 03:00 | 157 |
| 17.04.2024 02:45 | 157 |
| 17.04.2024 02:30 | 157 |
© Bayerisches Landesamt für Umwelt 2024