
- Startseite >
- Flüsse >
- Wasserstand >
- Unterer Main >
- Gollmuthhausen >
- Jahresgrafik

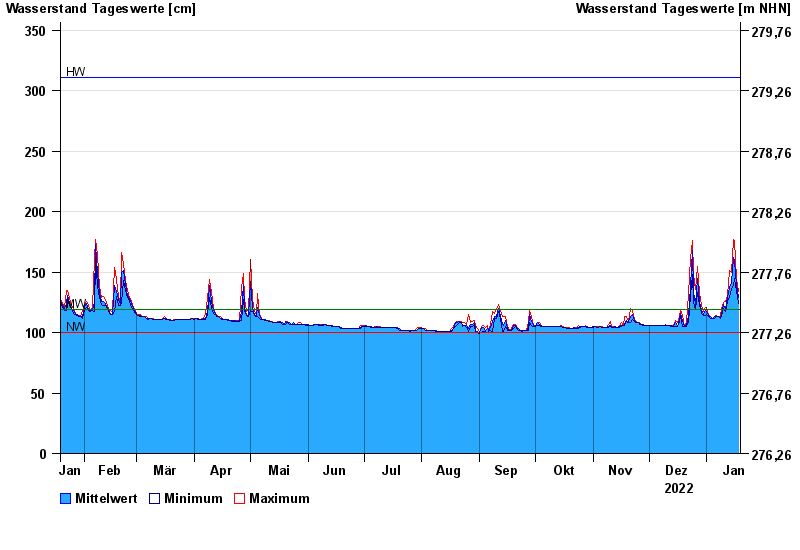
Jahresgrafik Gollmuthhausen / Milz
Wasserstand vom 19.01.2022 bis zum 18.01.2023
| Datum | Mittelwert [cm] | Maximum [cm] | Minimum [cm] |
|---|---|---|---|
| 18.01.2023 | 129 | 134 | 124 |
| 17.01.2023 | 140 | 145 | 134 |
| 16.01.2023 | 159 | 176 | 145 |
| 15.01.2023 | 162 | 177 | 139 |
| 14.01.2023 | 141 | 150 | 136 |
| 13.01.2023 | 137 | 151 | 129 |
| 12.01.2023 | 129 | 131 | 126 |
© Bayerisches Landesamt für Umwelt 2024