
- Startseite >
- Flüsse >
- Wasserstand >
- Unterer Main >
- Gollmuthhausen >
- Jahresgrafik

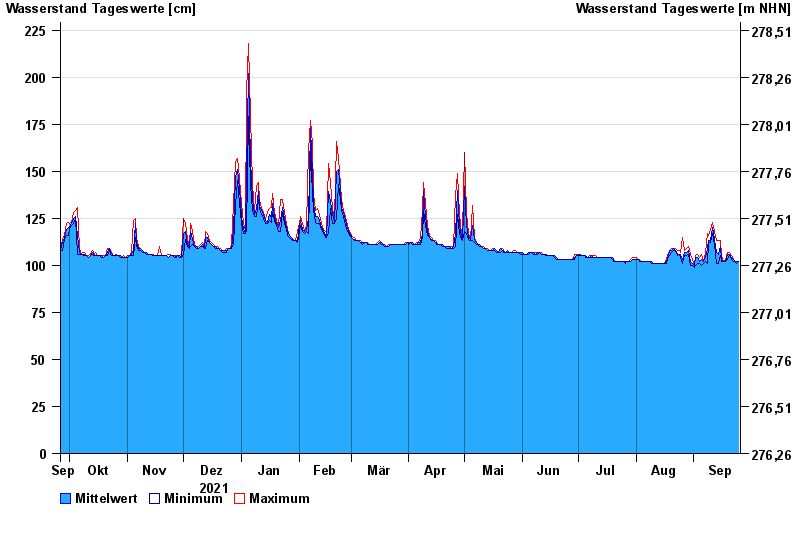
Jahresgrafik Gollmuthhausen / Milz
Wasserstand vom 26.09.2021 bis zum 25.09.2022
| Datum | Mittelwert [cm] | Maximum [cm] | Minimum [cm] |
|---|---|---|---|
| 25.09.2022 | 102 | 102 | 102 |
| 24.09.2022 | 102 | 102 | 101 |
| 23.09.2022 | 102 | 102 | 102 |
| 22.09.2022 | 103 | 103 | 102 |
| 21.09.2022 | 104 | 105 | 103 |
| 20.09.2022 | 106 | 107 | 105 |
| 19.09.2022 | 106 | 107 | 103 |
© Bayerisches Landesamt für Umwelt 2024