
- Startseite >
- Flüsse >
- Wasserstand >
- Unterer Main >
- Faulbach >
- Jahresgrafik

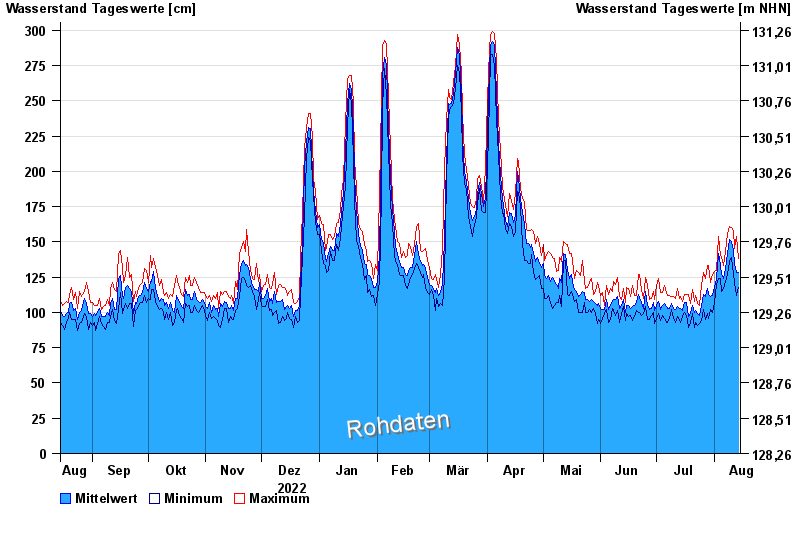
Jahresgrafik Faulbach / Main
Wasserstand vom 15.08.2022 bis zum 14.08.2023
| Datum | Mittelwert [cm] | Maximum [cm] | Minimum [cm] |
|---|---|---|---|
| 14.08.2023 | 128 | 138 | 118 |
| 13.08.2023 | 128 | 154 | 112 |
| 12.08.2023 | 135 | 145 | 121 |
| 11.08.2023 | 144 | 158 | 127 |
| 10.08.2023 | 150 | 160 | 139 |
| 09.08.2023 | 152 | 161 | 136 |
| 08.08.2023 | 142 | 156 | 127 |
© Bayerisches Landesamt für Umwelt 2024