
- Startseite >
- Flüsse >
- Wasserstand >
- Unterer Main >
- Faulbach >
- Jahresgrafik

Jahresgrafik Faulbach / Main
Wasserstand vom 09.03.2021 bis zum 08.03.2022
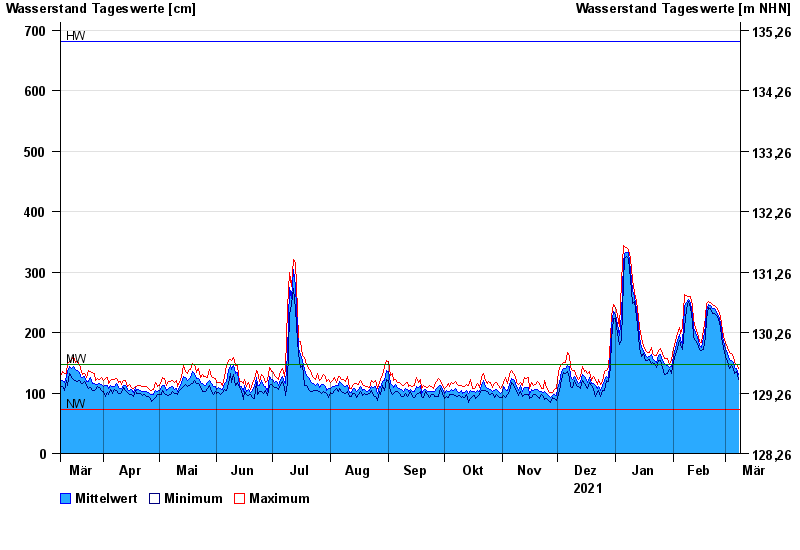
| Datum | Mittelwert [cm] | Maximum [cm] | Minimum [cm] |
|---|---|---|---|
| 08.03.2022 | 131 | 141 | 122 |
| 07.03.2022 | 141 | 148 | 135 |
| 06.03.2022 | 143 | 151 | 133 |
| 05.03.2022 | 150 | 160 | 139 |
| 04.03.2022 | 154 | 165 | 146 |
| 03.03.2022 | 156 | 167 | 140 |
| 02.03.2022 | 165 | 175 | 152 |
© Bayerisches Landesamt für Umwelt 2024