
- Startseite >
- Flüsse >
- Wasserstand >
- Unterer Main >
- Faulbach >
- Jahresgrafik

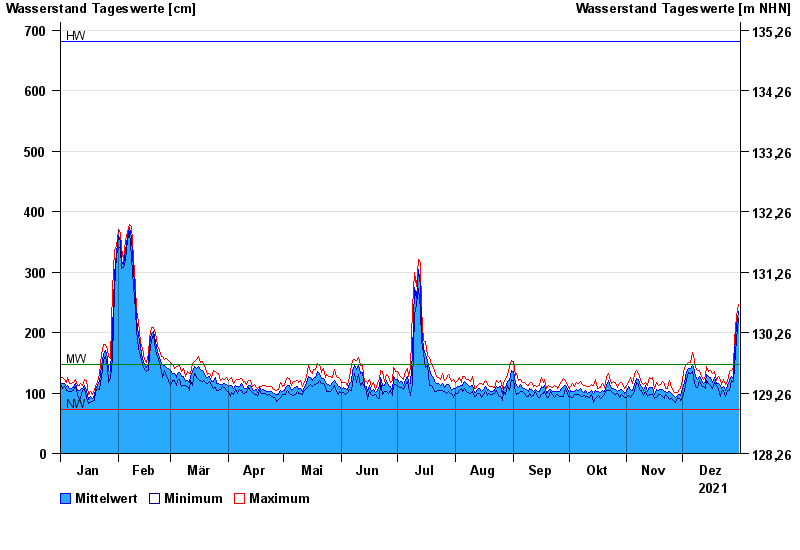
Jahresgrafik Faulbach / Main
Wasserstand vom 01.01.2021 bis zum 31.12.2021
| Datum | Mittelwert [cm] | Maximum [cm] | Minimum [cm] |
|---|---|---|---|
| 31.12.2021 | 234 | 246 | 223 |
| 30.12.2021 | 211 | 226 | 188 |
| 29.12.2021 | 169 | 188 | 142 |
| 28.12.2021 | 125 | 142 | 119 |
| 27.12.2021 | 127 | 137 | 120 |
| 26.12.2021 | 120 | 135 | 104 |
| 25.12.2021 | 112 | 119 | 105 |
© Bayerisches Landesamt für Umwelt 2024