
- Startseite >
- Flüsse >
- Wasserstand >
- Unterer Main >
- Faulbach >
- Jahresgrafik

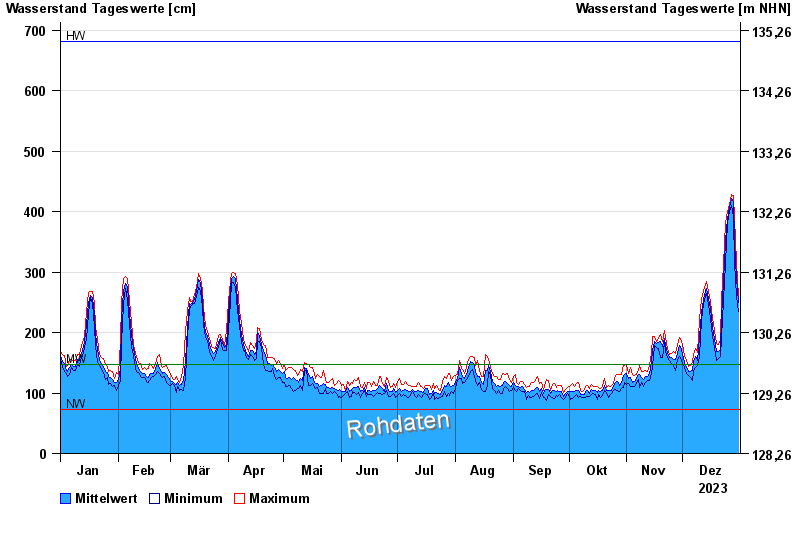
Jahresgrafik Faulbach / Main
Wasserstand vom 01.01.2023 bis zum 31.12.2023
| Datum | Mittelwert [cm] | Maximum [cm] | Minimum [cm] |
|---|---|---|---|
| 31.12.2023 | 249 | 260 | 234 |
| 30.12.2023 | 290 | 316 | 260 |
| 29.12.2023 | 350 | 389 | 316 |
| 28.12.2023 | 416 | 427 | 390 |
| 27.12.2023 | 421 | 428 | 410 |
| 26.12.2023 | 407 | 411 | 401 |
| 25.12.2023 | 389 | 401 | 382 |
© Bayerisches Landesamt für Umwelt 2024