
- Startseite >
- Flüsse >
- Wasserstand >
- Unterer Main >
- Faulbach >
- Jahresgrafik

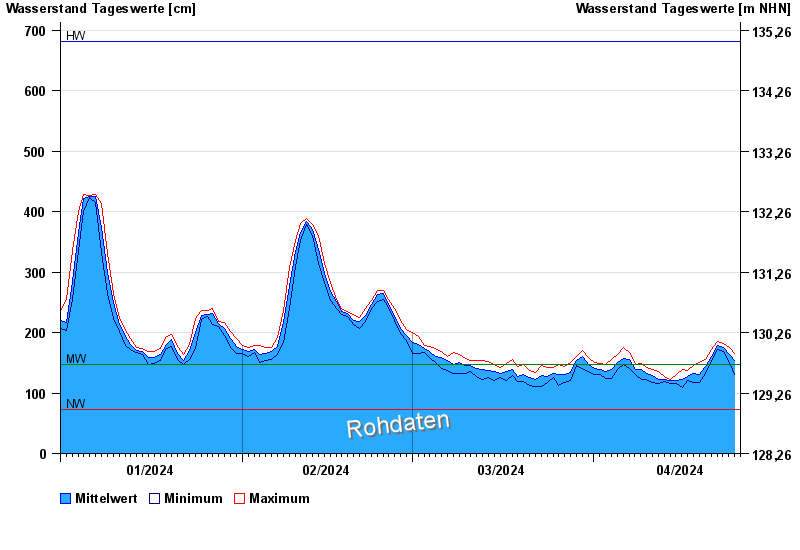
Jahresgrafik Faulbach / Main
Wasserstand vom 01.01.2024 bis zum 25.04.2024
| Datum | Mittelwert [cm] | Maximum [cm] | Minimum [cm] |
|---|---|---|---|
| 25.04.2024 | 161 | 165 | 152 |
| 24.04.2024 | 163 | 176 | 150 |
| 23.04.2024 | 175 | 182 | 168 |
| 22.04.2024 | 178 | 186 | 172 |
| 21.04.2024 | 161 | 172 | 152 |
| 20.04.2024 | 144 | 155 | 132 |
| 19.04.2024 | 131 | 150 | 117 |
© Bayerisches Landesamt für Umwelt 2024