
- Startseite >
- Flüsse >
- Wasserstand >
- Unterer Main >
- Birkenfeld >
- Jahresgrafik

Jahresgrafik Birkenfeld / Aisch
Wasserstand vom 29.05.2020 bis zum 28.05.2021
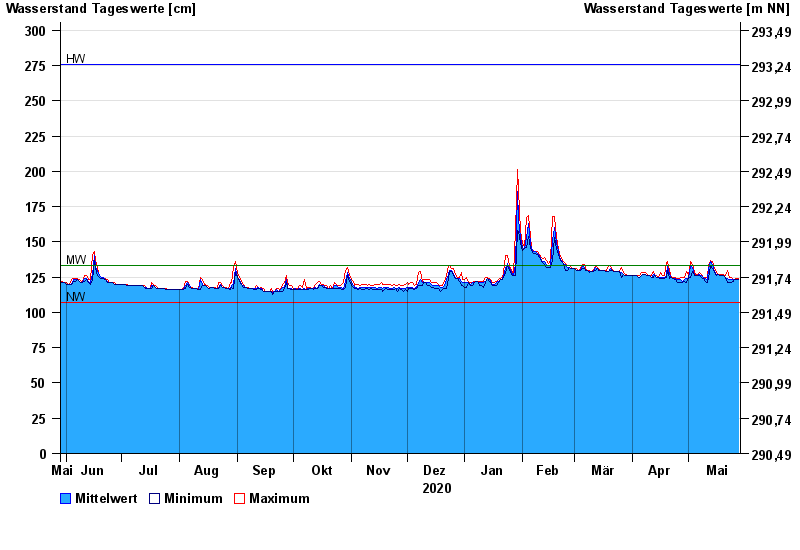
| Datum | Mittelwert [cm] | Maximum [cm] | Minimum [cm] |
|---|---|---|---|
| 28.05.2021 | 123 | 124 | 123 |
| 27.05.2021 | 123 | 124 | 123 |
| 26.05.2021 | 123 | 123 | 123 |
| 25.05.2021 | 123 | 123 | 122 |
| 24.05.2021 | 123 | 125 | 121 |
| 23.05.2021 | 123 | 125 | 121 |
| 22.05.2021 | 124 | 130 | 121 |
© Bayerisches Landesamt für Umwelt 2024