
- Startseite >
- Flüsse >
- Wasserstand >
- Unterer Main >
- Astheim >
- Jahresgrafik

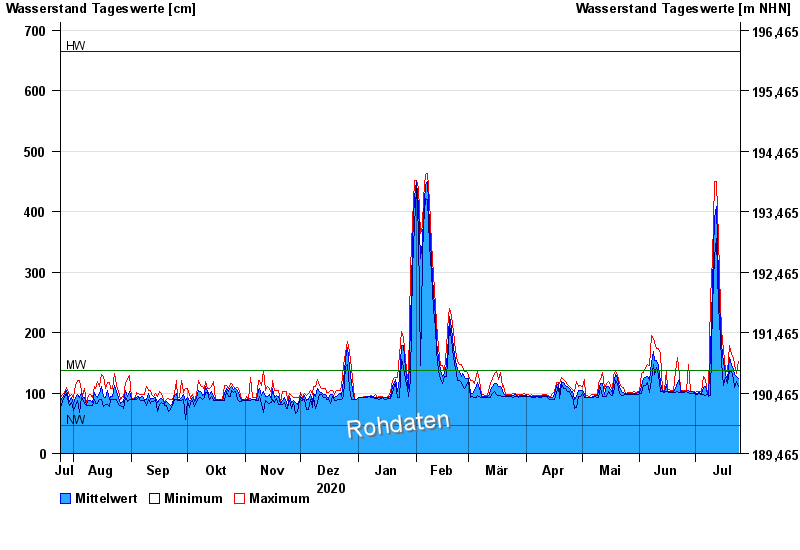
Jahresgrafik Astheim / Main
Wasserstand vom 25.07.2020 bis zum 24.07.2021
| Datum | Mittelwert [cm] | Maximum [cm] | Minimum [cm] |
|---|---|---|---|
| 24.07.2021 | 124 | 152 | 111 |
| 23.07.2021 | 127 | 133 | 119 |
| 22.07.2021 | 130 | 147 | 109 |
| 21.07.2021 | 139 | 158 | 122 |
| 20.07.2021 | 148 | 163 | 135 |
| 19.07.2021 | 158 | 179 | 135 |
| 18.07.2021 | 123 | 136 | 115 |
© Bayerisches Landesamt für Umwelt 2024