
- Startseite >
- Flüsse >
- Wasserstand >
- Unterer Main >
- Astheim >
- Jahresgrafik

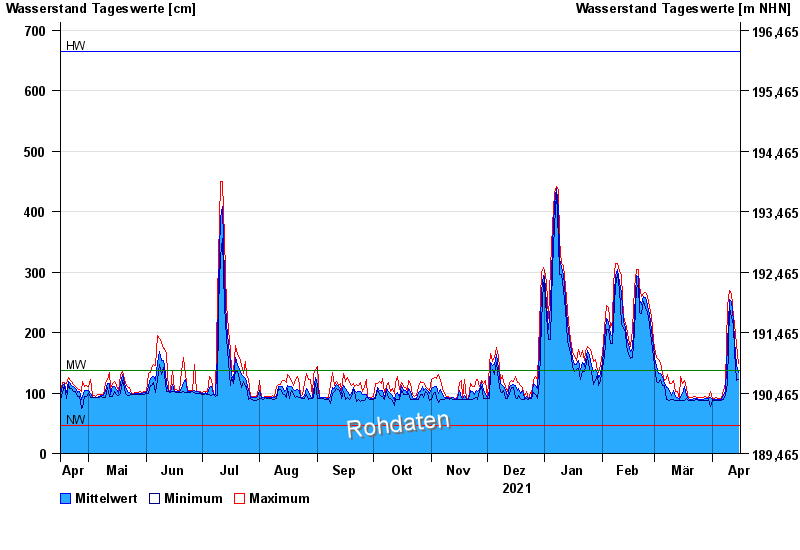
Jahresgrafik Astheim / Main
Wasserstand vom 16.04.2021 bis zum 15.04.2022
| Datum | Mittelwert [cm] | Maximum [cm] | Minimum [cm] |
|---|---|---|---|
| 15.04.2022 | 134 | 149 | 122 |
| 14.04.2022 | 146 | 180 | 120 |
| 13.04.2022 | 185 | 215 | 169 |
| 12.04.2022 | 219 | 225 | 212 |
| 11.04.2022 | 251 | 264 | 225 |
| 10.04.2022 | 255 | 269 | 242 |
| 09.04.2022 | 180 | 245 | 115 |
© Bayerisches Landesamt für Umwelt 2024