
- Startseite >
- Flüsse >
- Wasserstand >
- Obere Donau >
- Wiblingen >
- Monatsgrafik

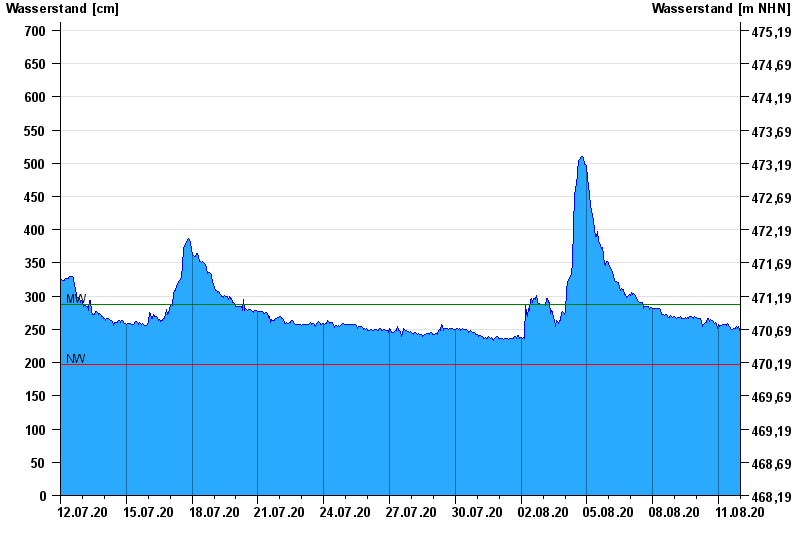
Monatsgrafik Wiblingen / Iller
Wasserstand vom 12.07.2020 bis zum 11.08.2020
| Datum | Wasserstand [cm] |
|---|---|
| 12.08.2020 00:45 | 245 |
| 12.08.2020 00:30 | 246 |
| 12.08.2020 00:15 | 247 |
| 12.08.2020 00:00 | 248 |
| 11.08.2020 23:45 | 249 |
| 11.08.2020 23:30 | 249 |
| 11.08.2020 23:15 | 249 |
© Bayerisches Landesamt für Umwelt 2024