
- Startseite >
- Flüsse >
- Wasserstand >
- Obere Donau >
- Treuchtlingen >
- Jahresgrafik

Jahresgrafik Treuchtlingen / Altmühl
Wasserstand vom 25.03.2023 bis zum 24.03.2024
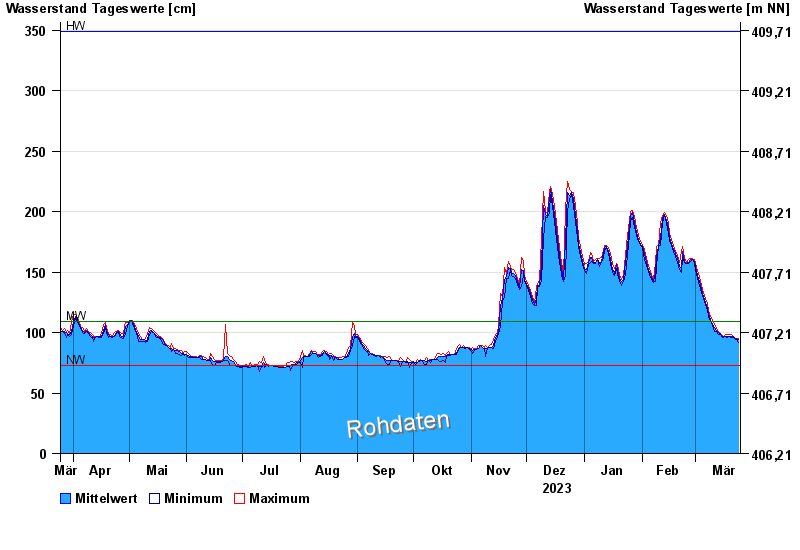
| Datum | Mittelwert [cm] | Maximum [cm] | Minimum [cm] |
|---|---|---|---|
| 24.03.2024 | 94 | 95 | 92 |
| 23.03.2024 | 95 | 95 | 94 |
| 22.03.2024 | 95 | 96 | 95 |
| 21.03.2024 | 97 | 97 | 96 |
| 20.03.2024 | 97 | 98 | 96 |
| 19.03.2024 | 97 | 98 | 97 |
| 18.03.2024 | 97 | 98 | 96 |
© Bayerisches Landesamt für Umwelt 2024