
- Startseite >
- Flüsse >
- Wasserstand >
- Obere Donau >
- Treuchtlingen >
- Jahresgrafik

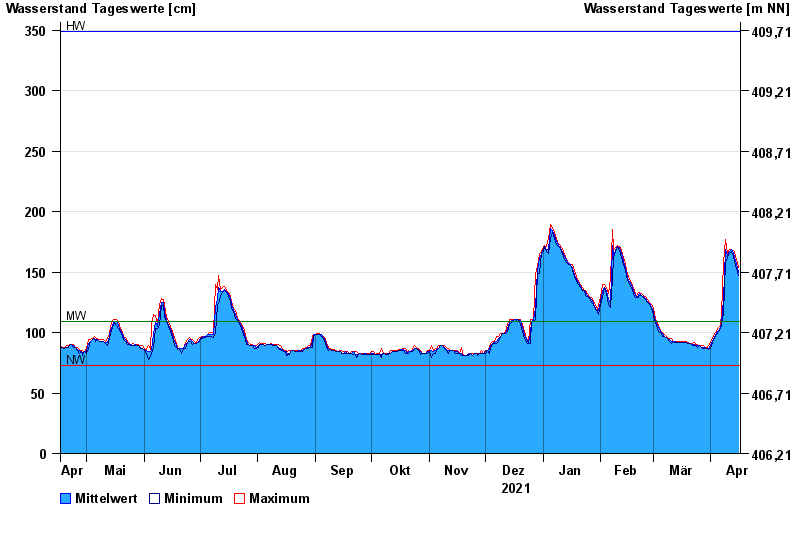
Jahresgrafik Treuchtlingen / Altmühl
Wasserstand vom 17.04.2021 bis zum 16.04.2022
| Datum | Mittelwert [cm] | Maximum [cm] | Minimum [cm] |
|---|---|---|---|
| 16.04.2022 | 150 | 154 | 147 |
| 15.04.2022 | 157 | 160 | 153 |
| 14.04.2022 | 162 | 166 | 159 |
| 13.04.2022 | 165 | 168 | 163 |
| 12.04.2022 | 169 | 169 | 167 |
| 11.04.2022 | 167 | 169 | 165 |
| 10.04.2022 | 164 | 165 | 162 |
© Bayerisches Landesamt für Umwelt 2024