
- Startseite >
- Flüsse >
- Wasserstand >
- Obere Donau >
- Roth >
- Jahresgrafik

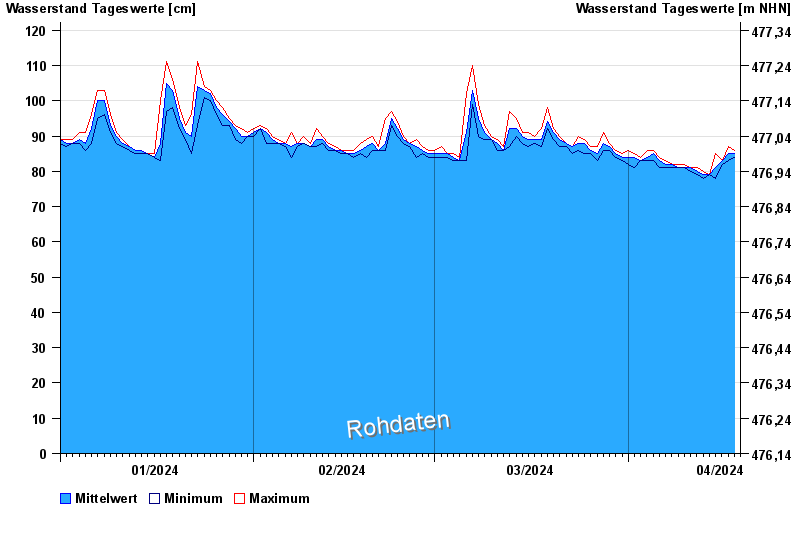
Jahresgrafik Roth / Roth
Wasserstand vom 01.01.2024 bis zum 18.04.2024
- 12.08.2002 Wasserstand: 182 cm
- 08.12.2010 Wasserstand: 179 cm
- 19.06.1991 Wasserstand: 176 cm
- 01.02.1982 Wasserstand: 176 cm
- 30.09.1981 Wasserstand: 174 cm
| Datum | Mittelwert [cm] | Maximum [cm] | Minimum [cm] |
|---|---|---|---|
| 18.04.2024 | 85 | 86 | 84 |
| 17.04.2024 | 85 | 87 | 83 |
| 16.04.2024 | 83 | 83 | 82 |
| 15.04.2024 | 81 | 85 | 78 |
| 14.04.2024 | 79 | 79 | 79 |
| 13.04.2024 | 79 | 80 | 78 |
| 12.04.2024 | 80 | 81 | 79 |
© Bayerisches Landesamt für Umwelt 2024