
- Startseite >
- Flüsse >
- Wasserstand >
- Obere Donau >
- Regensburg Eiserne Brücke >
- Jahresgrafik

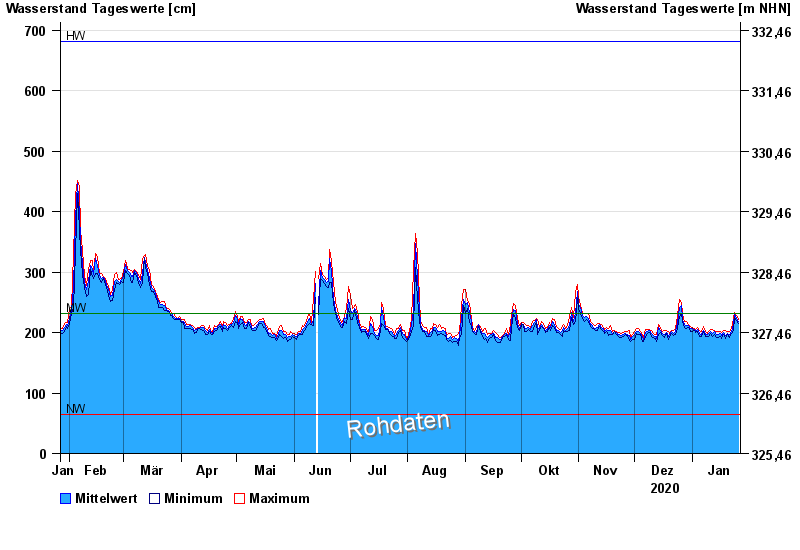
Jahresgrafik Regensburg Eiserne Brücke / Donau
Wasserstand vom 27.01.2020 bis zum 26.01.2021
| Datum | Mittelwert [cm] | Maximum [cm] | Minimum [cm] |
|---|---|---|---|
| 26.01.2021 | 219 | 222 | 215 |
| 25.01.2021 | 224 | 229 | 220 |
| 24.01.2021 | 230 | 233 | 225 |
| 23.01.2021 | 213 | 224 | 204 |
| 22.01.2021 | 202 | 207 | 198 |
| 21.01.2021 | 197 | 201 | 192 |
| 20.01.2021 | 198 | 201 | 196 |
© Bayerisches Landesamt für Umwelt 2024