
- Startseite >
- Flüsse >
- Wasserstand >
- Obere Donau >
- Regensburg Eiserne Brücke >
- Jahresgrafik

Jahresgrafik Regensburg Eiserne Brücke / Donau
Wasserstand vom 20.08.2019 bis zum 19.08.2020
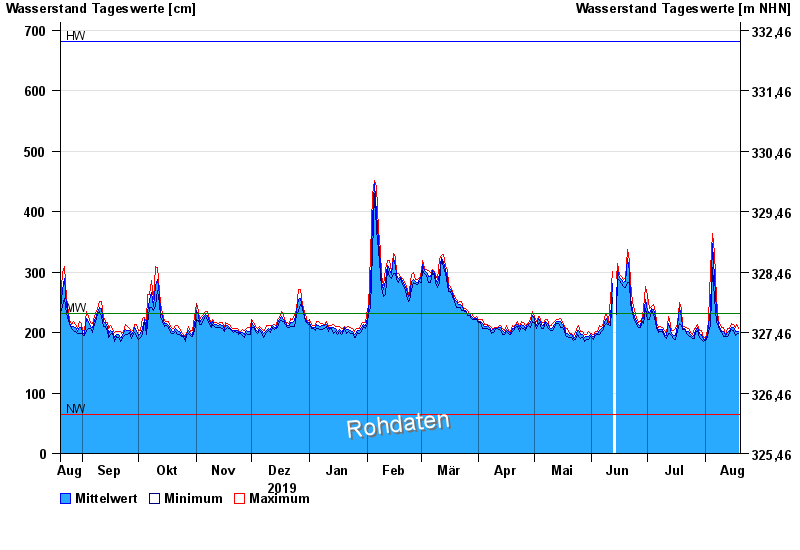
| Datum | Mittelwert [cm] | Maximum [cm] | Minimum [cm] |
|---|---|---|---|
| 19.08.2020 | 202 | 207 | 199 |
| 18.08.2020 | 202 | 213 | 196 |
| 17.08.2020 | 201 | 208 | 195 |
| 16.08.2020 | 208 | 213 | 203 |
| 15.08.2020 | 209 | 215 | 205 |
| 14.08.2020 | 202 | 206 | 198 |
| 13.08.2020 | 200 | 206 | 194 |
© Bayerisches Landesamt für Umwelt 2024