
- Startseite >
- Flüsse >
- Wasserstand >
- Obere Donau >
- Rasch >
- Jahresgrafik

Jahresgrafik Rasch / Schwarzach
Wasserstand vom 04.07.2022 bis zum 03.07.2023
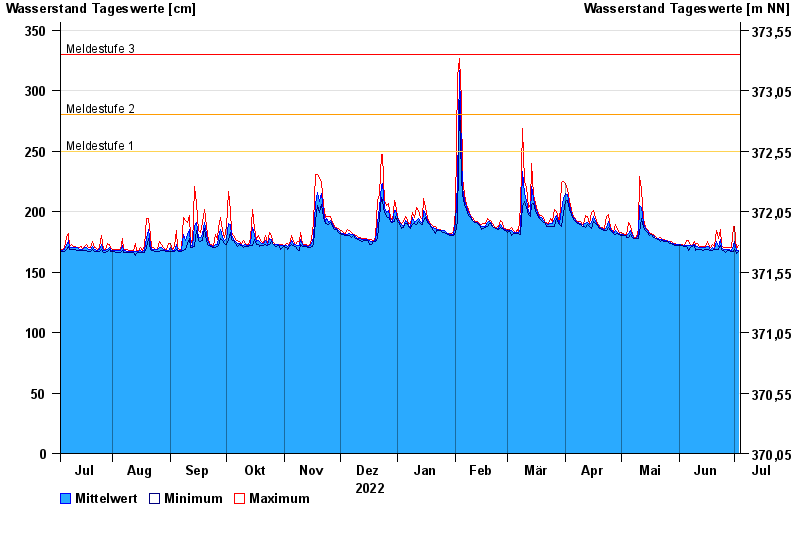
- Meldestufe 1 250 cm
- Meldestufe 2 280 cm
- Meldestufe 3 330 cm
- Meldestufe 4 400 cm
- Hochwassergefahrenfläche HQhäufig 380 cm
- Hochwassergefahrenfläche HQ100 430 cm
| Datum | Mittelwert [cm] | Maximum [cm] | Minimum [cm] |
|---|---|---|---|
| 03.07.2023 | 168 | 172 | 167 |
| 02.07.2023 | 168 | 169 | 165 |
| 01.07.2023 | 175 | 188 | 169 |
| 30.06.2023 | 172 | 188 | 167 |
| 29.06.2023 | 168 | 170 | 167 |
| 28.06.2023 | 169 | 170 | 168 |
| 27.06.2023 | 169 | 170 | 168 |
© Bayerisches Landesamt für Umwelt 2024