
- Startseite >
- Flüsse >
- Wasserstand >
- Obere Donau >
- Pfaffenhofen >
- Jahresgrafik

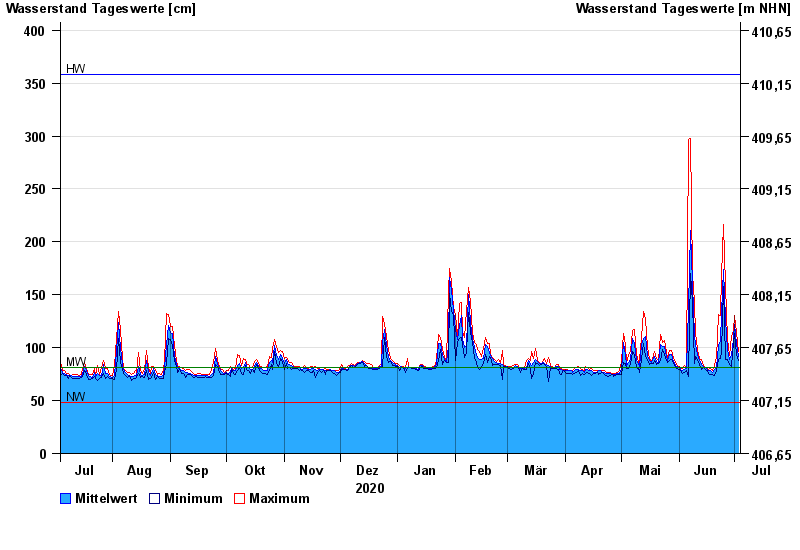
Jahresgrafik Pfaffenhofen / Zusam
Wasserstand vom 04.07.2020 bis zum 03.07.2021
| Datum | Mittelwert [cm] | Maximum [cm] | Minimum [cm] |
|---|---|---|---|
| 03.07.2021 | 92 | 96 | 88 |
| 02.07.2021 | 104 | 114 | 94 |
| 01.07.2021 | 122 | 130 | 113 |
| 30.06.2021 | 109 | 116 | 105 |
| 29.06.2021 | 93 | 111 | 82 |
| 28.06.2021 | 89 | 93 | 84 |
| 27.06.2021 | 98 | 108 | 89 |
© Bayerisches Landesamt für Umwelt 2024