
- Startseite >
- Flüsse >
- Wasserstand >
- Obere Donau >
- Oberndorf >
- Jahresgrafik

Jahresgrafik Oberndorf / Donau
Wasserstand vom 01.01.2024 bis zum 18.04.2024
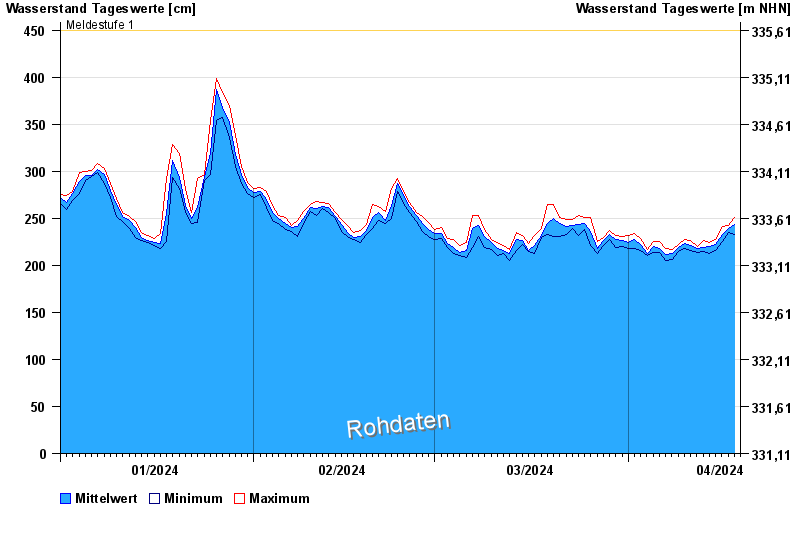
- Meldestufe 1 450 cm
- Meldestufe 2 480 cm
- Meldestufe 3 550 cm
- Meldestufe 4 610 cm
- Hochwassergefahrenfläche HQ100 770 cm
- Hochwassergefahrenfläche HQhäufig 640 cm
| Datum | Mittelwert [cm] | Maximum [cm] | Minimum [cm] |
|---|---|---|---|
| 18.04.2024 | 237 | 245 | 233 |
| 17.04.2024 | 239 | 242 | 235 |
| 16.04.2024 | 233 | 241 | 225 |
| 15.04.2024 | 222 | 227 | 216 |
| 14.04.2024 | 220 | 224 | 213 |
| 13.04.2024 | 219 | 226 | 215 |
| 12.04.2024 | 218 | 220 | 214 |
© Bayerisches Landesamt für Umwelt 2024