
- Startseite >
- Flüsse >
- Wasserstand >
- Obere Donau >
- Mühlried >
- Jahresgrafik

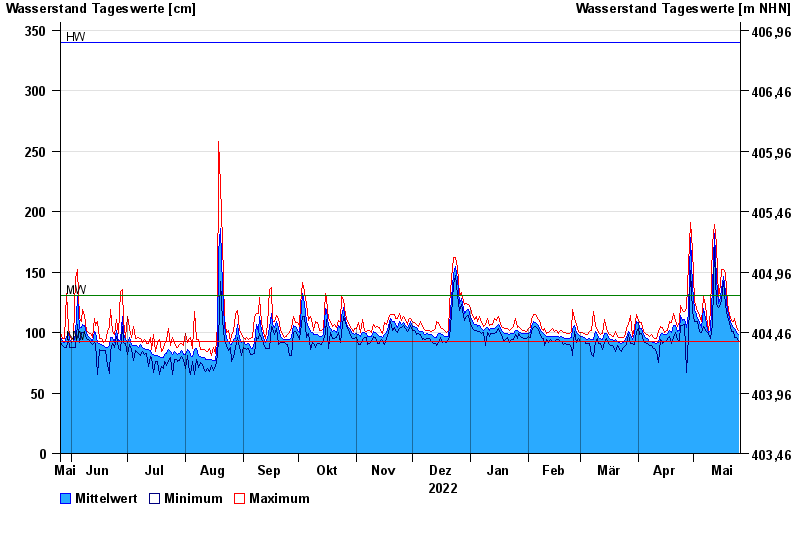
Jahresgrafik Mühlried / Paar
Wasserstand vom 26.05.2022 bis zum 25.05.2023
Hinweis
Geber 2 Defekt
| Datum | Mittelwert [cm] | Maximum [cm] | Minimum [cm] |
|---|---|---|---|
| 25.05.2023 | 98 | 102 | 93 |
| 24.05.2023 | 100 | 104 | 96 |
| 23.05.2023 | 103 | 112 | 96 |
| 22.05.2023 | 104 | 109 | 101 |
| 21.05.2023 | 107 | 110 | 101 |
| 20.05.2023 | 112 | 115 | 108 |
| 19.05.2023 | 118 | 124 | 113 |
© Bayerisches Landesamt für Umwelt 2024