
- Startseite >
- Flüsse >
- Wasserstand >
- Obere Donau >
- Moosburg >
- Monatsgrafik

Monatsgrafik Moosburg / Isar
Wasserstand vom 28.09.2022 bis zum 27.10.2022
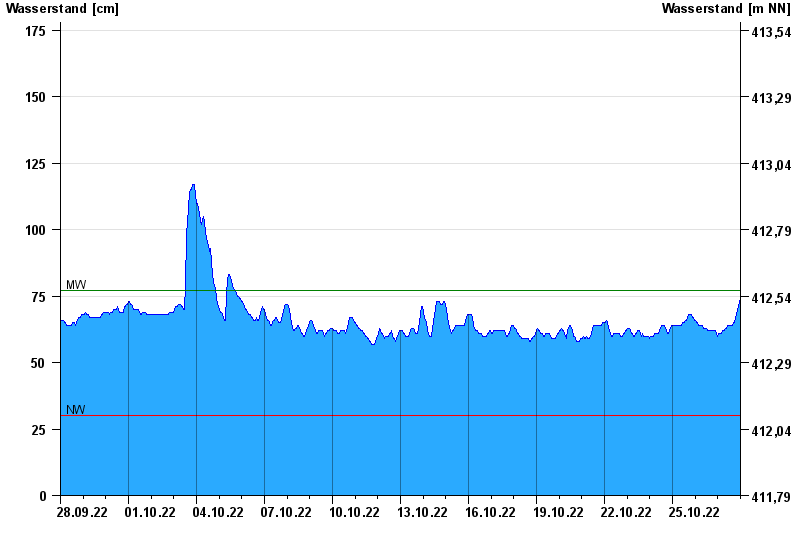
| Datum | Wasserstand [cm] |
|---|---|
| 28.10.2022 00:45 | 72 |
| 28.10.2022 00:30 | 73 |
| 28.10.2022 00:15 | 73 |
| 28.10.2022 00:00 | 73 |
| 27.10.2022 23:45 | 74 |
| 27.10.2022 23:30 | 74 |
| 27.10.2022 23:15 | 73 |
© Bayerisches Landesamt für Umwelt 2024