
- Startseite >
- Flüsse >
- Wasserstand >
- Obere Donau >
- Langerringen >
- Jahresgrafik

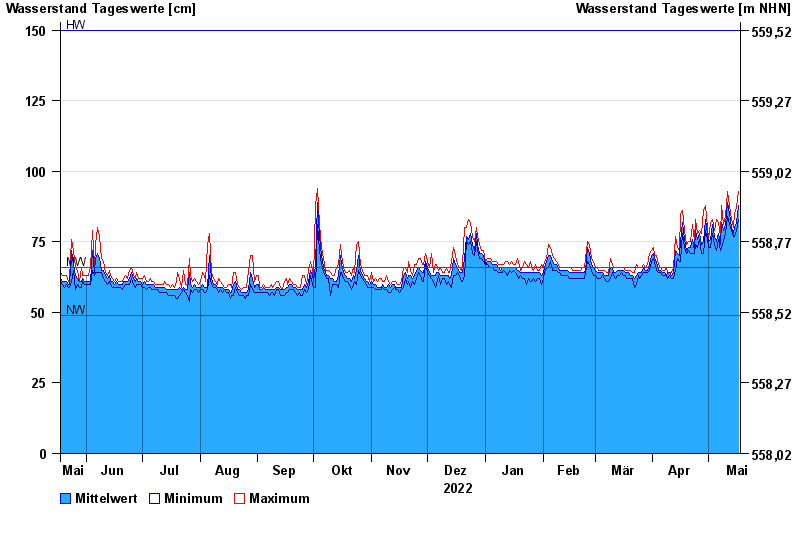
Jahresgrafik Langerringen / Singold
Wasserstand vom 18.05.2022 bis zum 17.05.2023
| Datum | Mittelwert [cm] | Maximum [cm] | Minimum [cm] |
|---|---|---|---|
| 17.05.2023 | 88 | 93 | 83 |
| 16.05.2023 | 82 | 87 | 79 |
| 15.05.2023 | 80 | 85 | 77 |
| 14.05.2023 | 78 | 80 | 77 |
| 13.05.2023 | 80 | 83 | 79 |
| 12.05.2023 | 85 | 88 | 81 |
| 11.05.2023 | 89 | 93 | 84 |
© Bayerisches Landesamt für Umwelt 2024