
- Startseite >
- Flüsse >
- Wasserstand >
- Obere Donau >
- Langengeisling >
- Jahresgrafik

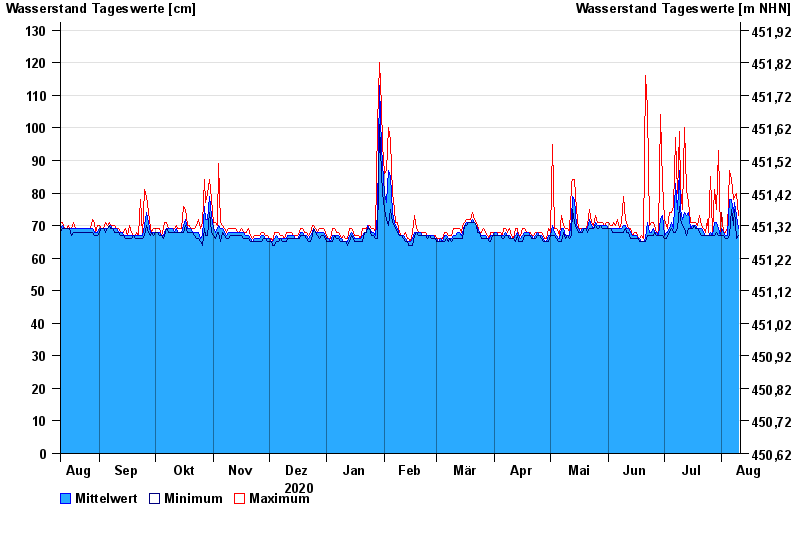
Jahresgrafik Langengeisling / Saubach
Wasserstand vom 11.08.2020 bis zum 10.08.2021
| Datum | Mittelwert [cm] | Maximum [cm] | Minimum [cm] |
|---|---|---|---|
| 10.08.2021 | 69 | 73 | 67 |
| 09.08.2021 | 73 | 80 | 66 |
| 08.08.2021 | 77 | 79 | 75 |
| 07.08.2021 | 74 | 78 | 70 |
| 06.08.2021 | 78 | 84 | 75 |
| 05.08.2021 | 78 | 87 | 67 |
| 04.08.2021 | 67 | 69 | 66 |
© Bayerisches Landesamt für Umwelt 2024