
- Startseite >
- Flüsse >
- Wasserstand >
- Obere Donau >
- Langengeisling >
- Jahresgrafik

Jahresgrafik Langengeisling / Saubach
Wasserstand vom 21.09.2020 bis zum 20.09.2021
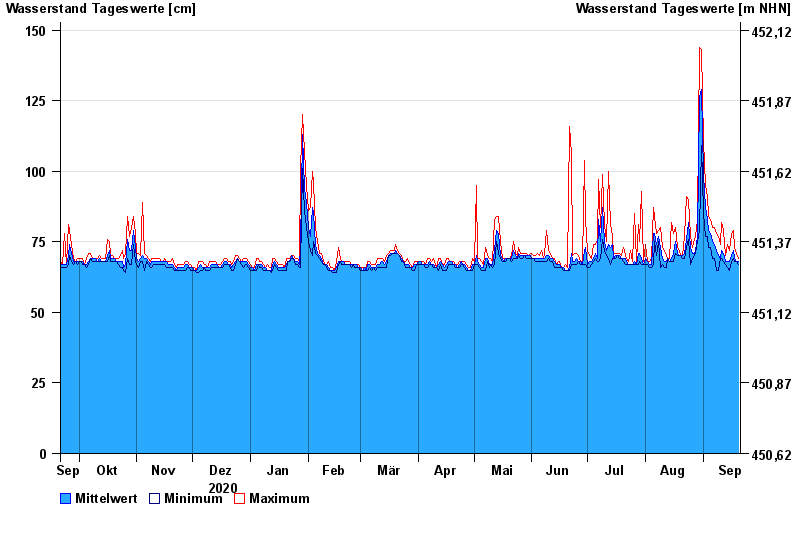
| Datum | Mittelwert [cm] | Maximum [cm] | Minimum [cm] |
|---|---|---|---|
| 20.09.2021 | 68 | 69 | 67 |
| 19.09.2021 | 68 | 71 | 68 |
| 18.09.2021 | 69 | 73 | 68 |
| 17.09.2021 | 72 | 79 | 69 |
| 16.09.2021 | 70 | 78 | 68 |
| 15.09.2021 | 68 | 72 | 65 |
| 14.09.2021 | 68 | 74 | 66 |
© Bayerisches Landesamt für Umwelt 2024