
- Startseite >
- Flüsse >
- Wasserstand >
- Obere Donau >
- Langengeisling >
- Jahresgrafik

Jahresgrafik Langengeisling / Saubach
Wasserstand vom 07.03.2021 bis zum 06.03.2022
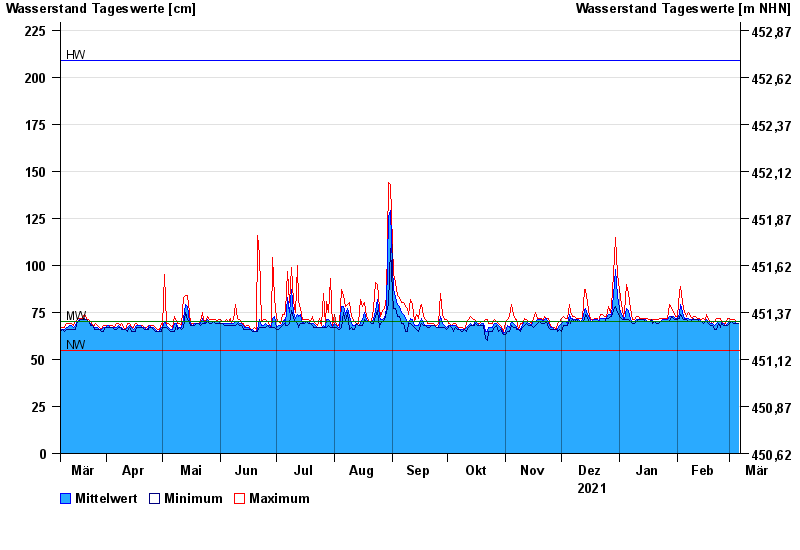
| Datum | Mittelwert [cm] | Maximum [cm] | Minimum [cm] |
|---|---|---|---|
| 06.03.2022 | 69 | 70 | 69 |
| 05.03.2022 | 69 | 70 | 69 |
| 04.03.2022 | 70 | 71 | 69 |
| 03.03.2022 | 70 | 71 | 69 |
| 02.03.2022 | 70 | 71 | 70 |
| 01.03.2022 | 70 | 72 | 69 |
| 28.02.2022 | 69 | 72 | 68 |
© Bayerisches Landesamt für Umwelt 2024