
- Startseite >
- Flüsse >
- Wasserstand >
- Obere Donau >
- Hasberg >
- Jahresgrafik

Jahresgrafik Hasberg / Mindel
Wasserstand vom 23.06.2019 bis zum 22.06.2020
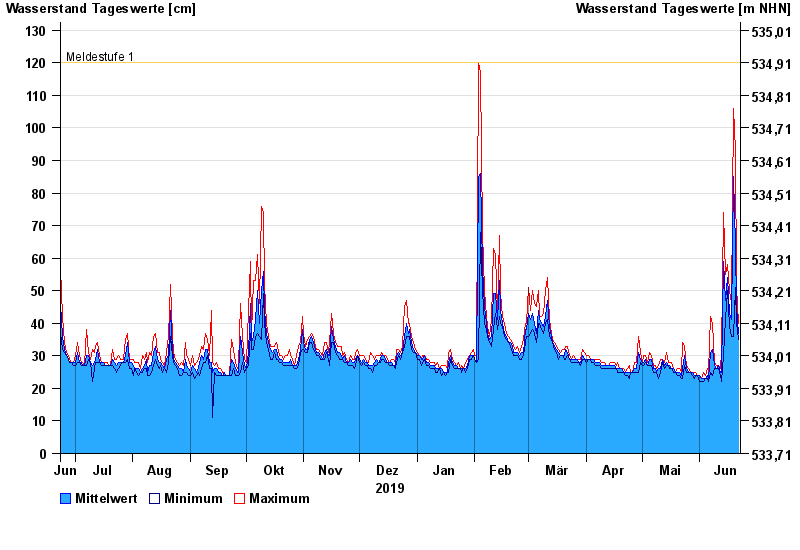
- Meldestufe 1 120 cm
- Meldestufe 2 140 cm
- Meldestufe 3 160 cm
- Meldestufe 4 180 cm
| Datum | Mittelwert [cm] | Maximum [cm] | Minimum [cm] |
|---|---|---|---|
| 22.06.2020 | 37 | 40 | 35 |
| 21.06.2020 | 45 | 51 | 40 |
| 20.06.2020 | 64 | 93 | 51 |
| 19.06.2020 | 85 | 106 | 36 |
| 18.06.2020 | 41 | 46 | 36 |
| 17.06.2020 | 43 | 50 | 39 |
| 16.06.2020 | 54 | 58 | 50 |
© Bayerisches Landesamt für Umwelt 2024