
- Startseite >
- Flüsse >
- Wasserstand >
- Obere Donau >
- Hasberg >
- Jahresgrafik

Jahresgrafik Hasberg / Mindel
Wasserstand vom 25.07.2021 bis zum 24.07.2022
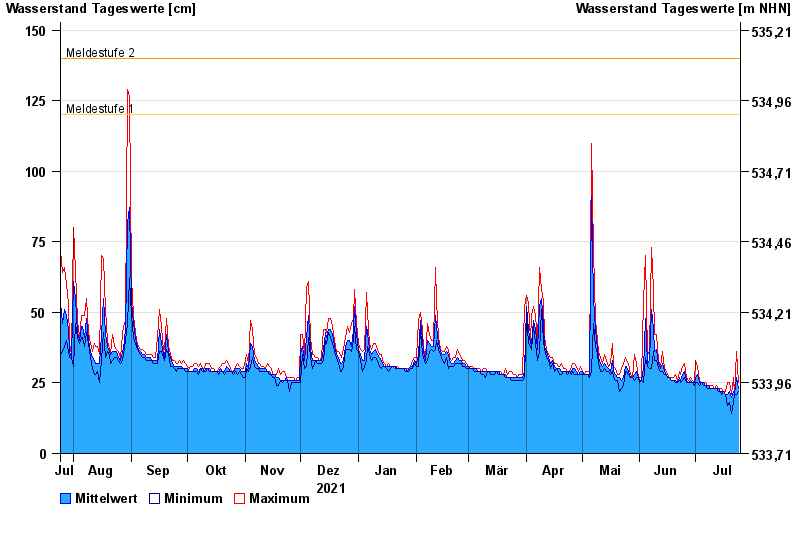
- Meldestufe 1 120 cm
- Meldestufe 2 140 cm
- Meldestufe 3 160 cm
- Meldestufe 4 180 cm
| Datum | Mittelwert [cm] | Maximum [cm] | Minimum [cm] |
|---|---|---|---|
| 24.07.2022 | 23 | 25 | 22 |
| 23.07.2022 | 27 | 36 | 21 |
| 22.07.2022 | 21 | 21 | 21 |
| 21.07.2022 | 22 | 27 | 18 |
| 20.07.2022 | 20 | 21 | 14 |
| 19.07.2022 | 22 | 25 | 18 |
| 18.07.2022 | 21 | 25 | 17 |
© Bayerisches Landesamt für Umwelt 2024