
- Startseite >
- Flüsse >
- Wasserstand >
- Obere Donau >
- Hasberg >
- Jahresgrafik

Jahresgrafik Hasberg / Östliche Mindel
Wasserstand vom 10.08.2022 bis zum 09.08.2023
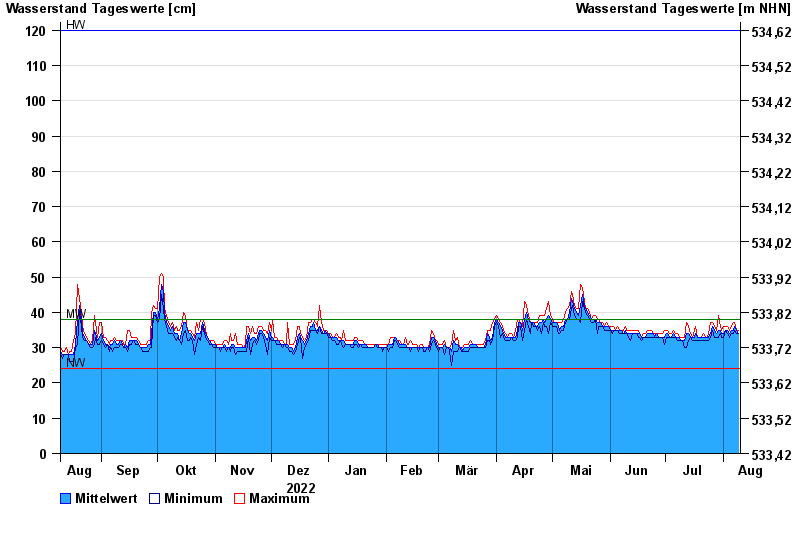
| Datum | Mittelwert [cm] | Maximum [cm] | Minimum [cm] |
|---|---|---|---|
| 09.08.2023 | 34 | 35 | 34 |
| 08.08.2023 | 35 | 35 | 34 |
| 07.08.2023 | 36 | 37 | 35 |
| 06.08.2023 | 35 | 37 | 34 |
| 05.08.2023 | 35 | 36 | 34 |
| 04.08.2023 | 34 | 35 | 33 |
| 03.08.2023 | 35 | 36 | 34 |
© Bayerisches Landesamt für Umwelt 2024