
- Startseite >
- Flüsse >
- Wasserstand >
- Obere Donau >
- Grafrath >
- Jahresgrafik

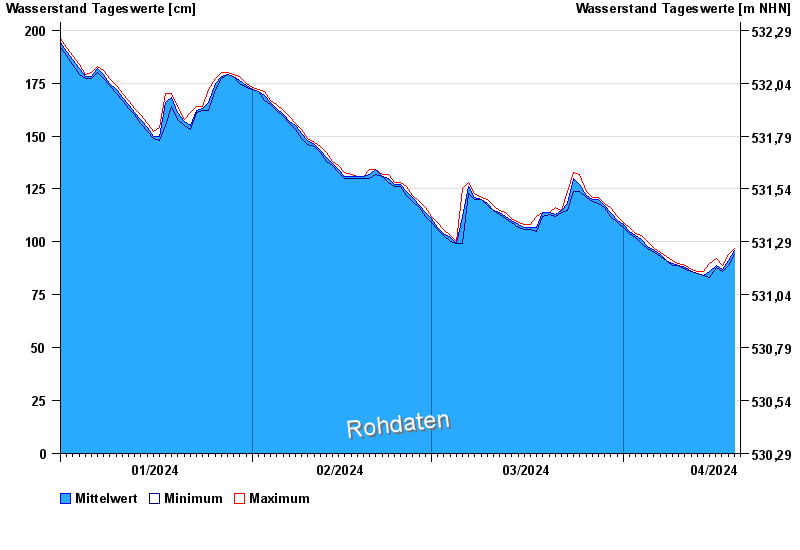
Jahresgrafik Grafrath / Amper
Wasserstand vom 01.01.2024 bis zum 19.04.2024
- Hochwassergefahrenfläche HQ100 350 cm
| Datum | Mittelwert [cm] | Maximum [cm] | Minimum [cm] |
|---|---|---|---|
| 19.04.2024 | 94 | 96 | 94 |
| 18.04.2024 | 91 | 94 | 89 |
| 17.04.2024 | 87 | 89 | 86 |
| 16.04.2024 | 89 | 92 | 88 |
| 15.04.2024 | 86 | 90 | 83 |
| 14.04.2024 | 84 | 86 | 84 |
| 13.04.2024 | 85 | 86 | 85 |
© Bayerisches Landesamt für Umwelt 2024