
- Startseite >
- Flüsse >
- Wasserstand >
- Obere Donau >
- Gerlenhofen >
- Jahresgrafik

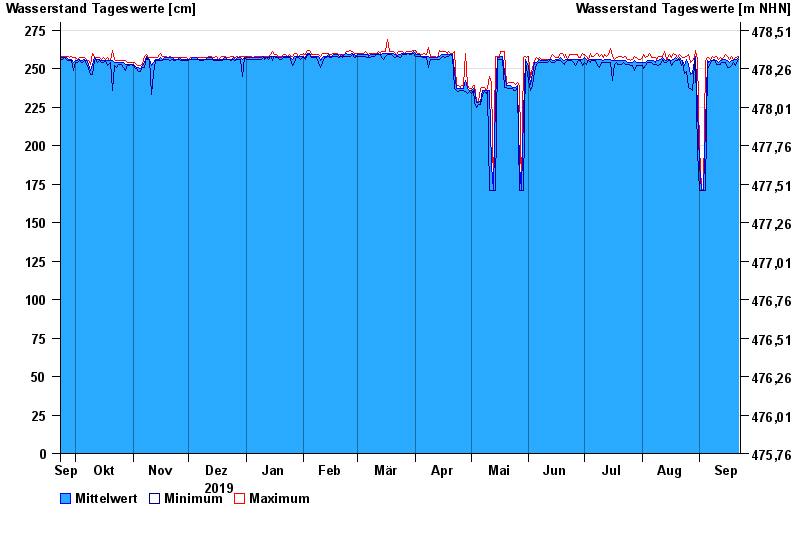
Jahresgrafik Gerlenhofen / Illerkanal
Wasserstand vom 23.09.2019 bis zum 22.09.2020
| Datum | Mittelwert [cm] | Maximum [cm] | Minimum [cm] |
|---|---|---|---|
| 22.09.2020 | 257 | 258 | 256 |
| 21.09.2020 | 256 | 257 | 254 |
| 20.09.2020 | 256 | 257 | 252 |
| 19.09.2020 | 255 | 256 | 254 |
| 18.09.2020 | 255 | 258 | 252 |
| 17.09.2020 | 254 | 256 | 251 |
| 16.09.2020 | 255 | 258 | 251 |
© Bayerisches Landesamt für Umwelt 2024