
- Startseite >
- Flüsse >
- Wasserstand >
- Obere Donau >
- Gerlenhofen >
- Jahresgrafik

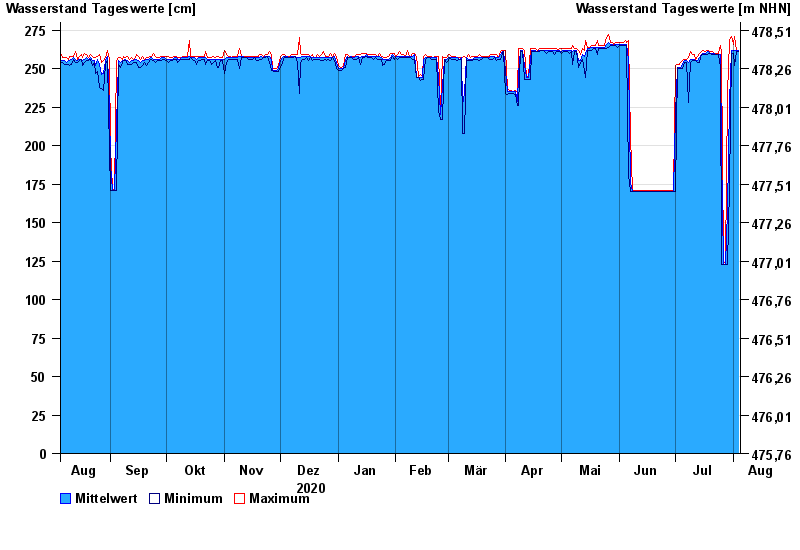
Jahresgrafik Gerlenhofen / Illerkanal
Wasserstand vom 05.08.2020 bis zum 04.08.2021
| Datum | Mittelwert [cm] | Maximum [cm] | Minimum [cm] |
|---|---|---|---|
| 04.08.2021 | 262 | 262 | 261 |
| 03.08.2021 | 262 | 262 | 261 |
| 02.08.2021 | 262 | 271 | 252 |
| 01.08.2021 | 262 | 266 | 260 |
| 31.07.2021 | 262 | 271 | 260 |
| 30.07.2021 | 229 | 268 | 173 |
| 29.07.2021 | 158 | 234 | 123 |
© Bayerisches Landesamt für Umwelt 2024