
- Startseite >
- Flüsse >
- Wasserstand >
- Obere Donau >
- Eichstätt >
- Jahresgrafik

Jahresgrafik Eichstätt / Altmühl
Wasserstand vom 06.03.2020 bis zum 05.03.2021
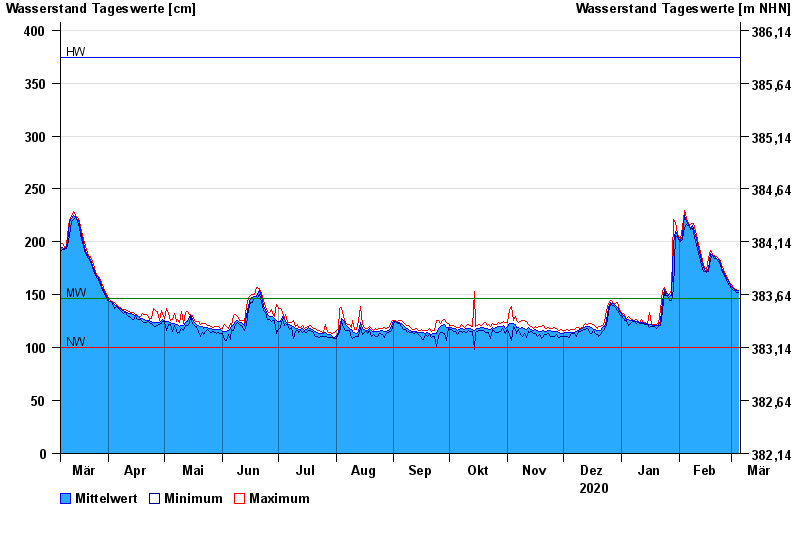
| Datum | Mittelwert [cm] | Maximum [cm] | Minimum [cm] |
|---|---|---|---|
| 05.03.2021 | 154 | 154 | 152 |
| 04.03.2021 | 154 | 155 | 152 |
| 03.03.2021 | 154 | 155 | 154 |
| 02.03.2021 | 156 | 157 | 154 |
| 01.03.2021 | 158 | 160 | 156 |
| 28.02.2021 | 161 | 162 | 159 |
| 27.02.2021 | 164 | 166 | 162 |
© Bayerisches Landesamt für Umwelt 2024