
- Startseite >
- Flüsse >
- Wasserstand >
- Obere Donau >
- Blumenthal >
- Jahresgrafik

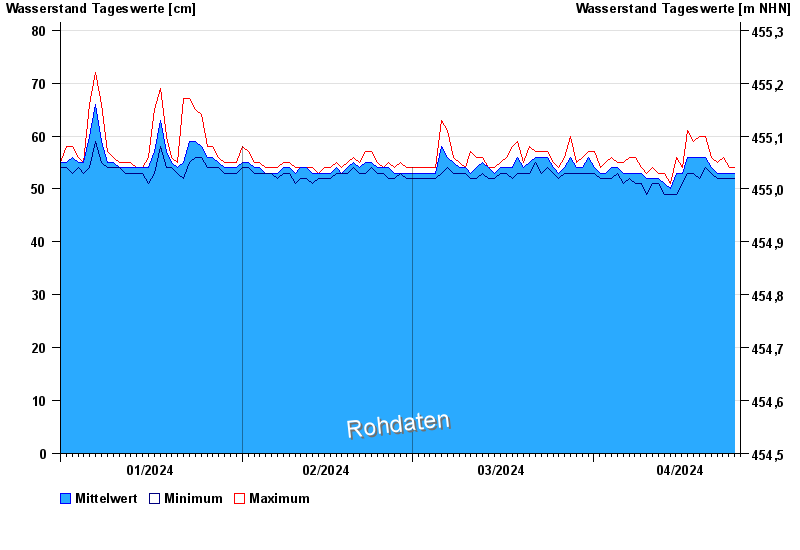
Jahresgrafik Blumenthal / Ecknach
Wasserstand vom 01.01.2024 bis zum 25.04.2024
 Für diesen Pegel sind keine Hochwassermarken hinterlegt.
| Datum | Mittelwert [cm] | Maximum [cm] | Minimum [cm] |
|---|---|---|---|
| 25.04.2024 | 53 | 54 | 52 |
| 24.04.2024 | 53 | 54 | 52 |
| 23.04.2024 | 53 | 56 | 52 |
| 22.04.2024 | 53 | 55 | 52 |
| 21.04.2024 | 54 | 56 | 53 |
| 20.04.2024 | 56 | 60 | 54 |
| 19.04.2024 | 56 | 60 | 52 |
© Bayerisches Landesamt für Umwelt 2024