
- Startseite >
- Flüsse >
- Wasserstand >
- Obere Donau >
- Binzwangen >
- Jahresgrafik

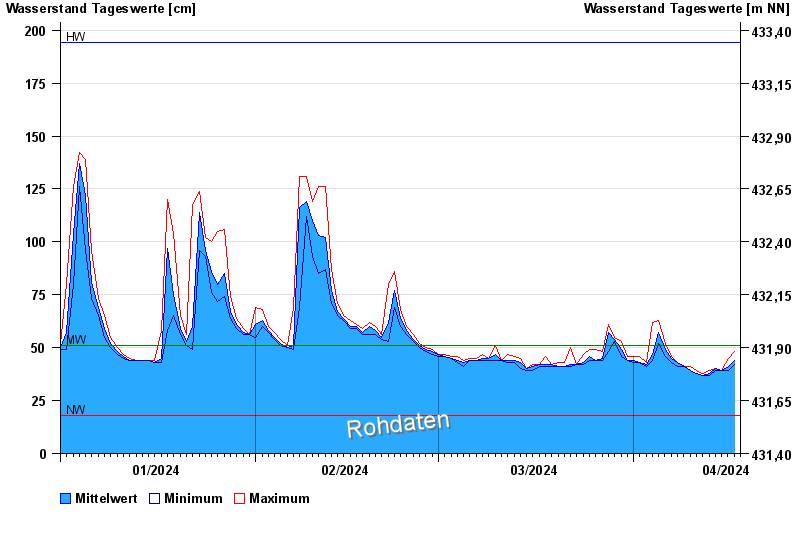
Jahresgrafik Binzwangen / Altmühl
Wasserstand vom 01.01.2024 bis zum 17.04.2024
Hinweis
Wasserstand und Abfluss wird zeitweise durch Biberdamm beeinflusst.
| Datum | Mittelwert [cm] | Maximum [cm] | Minimum [cm] |
|---|---|---|---|
| 17.04.2024 | 44 | 48 | 42 |
| 16.04.2024 | 41 | 45 | 39 |
| 15.04.2024 | 39 | 39 | 39 |
| 14.04.2024 | 40 | 40 | 39 |
| 13.04.2024 | 38 | 39 | 37 |
| 12.04.2024 | 37 | 38 | 37 |
| 11.04.2024 | 38 | 39 | 38 |
© Bayerisches Landesamt für Umwelt 2024