
- Startseite >
- Flüsse >
- Wasserstand >
- Obere Donau >
- Bergkirchen >
- Jahresgrafik

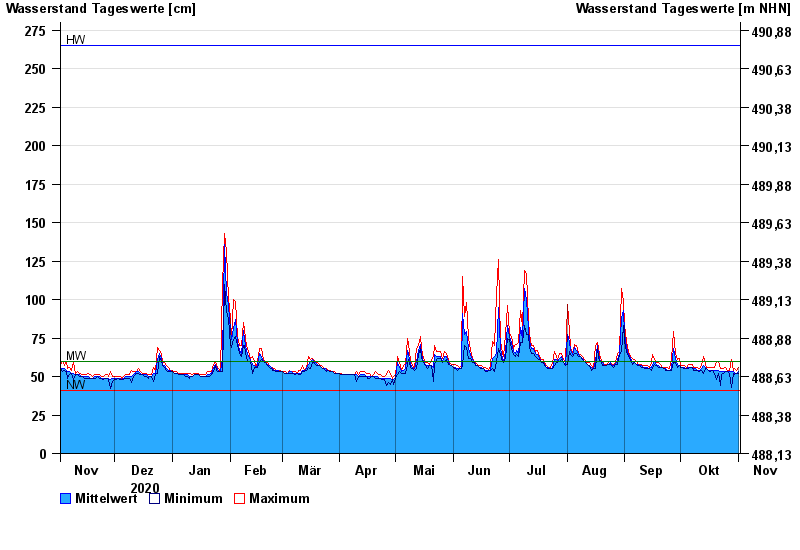
Jahresgrafik Bergkirchen / Maisach
Wasserstand vom 02.11.2020 bis zum 01.11.2021
| Datum | Mittelwert [cm] | Maximum [cm] | Minimum [cm] |
|---|---|---|---|
| 01.11.2021 | 53 | 56 | 52 |
| 31.10.2021 | 52 | 54 | 52 |
| 30.10.2021 | 52 | 55 | 51 |
| 29.10.2021 | 53 | 54 | 52 |
| 28.10.2021 | 53 | 61 | 43 |
| 27.10.2021 | 53 | 54 | 52 |
| 26.10.2021 | 53 | 54 | 53 |
© Bayerisches Landesamt für Umwelt 2024