
- Startseite >
- Flüsse >
- Wasserstand >
- Obere Donau >
- Beilngries oberh. der Sulz >
- Jahresgrafik

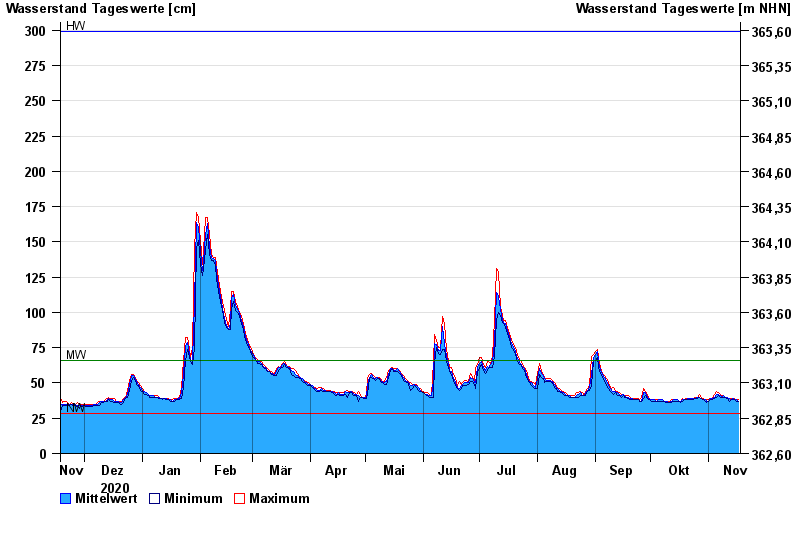
Jahresgrafik Beilngries oberh. der Sulz / Altmühl
Wasserstand vom 18.11.2020 bis zum 17.11.2021
| Datum | Mittelwert [cm] | Maximum [cm] | Minimum [cm] |
|---|---|---|---|
| 17.11.2021 | 37 | 38 | 37 |
| 16.11.2021 | 38 | 38 | 37 |
| 15.11.2021 | 38 | 39 | 38 |
| 14.11.2021 | 39 | 39 | 38 |
| 13.11.2021 | 38 | 39 | 38 |
| 12.11.2021 | 39 | 39 | 37 |
| 11.11.2021 | 40 | 40 | 39 |
© Bayerisches Landesamt für Umwelt 2024