
- Startseite >
- Flüsse >
- Wasserstand >
- Obere Donau >
- Beilngries oberh. der Sulz >
- Jahresgrafik

Jahresgrafik Beilngries oberh. der Sulz / Altmühl
Wasserstand vom 28.02.2021 bis zum 27.02.2022
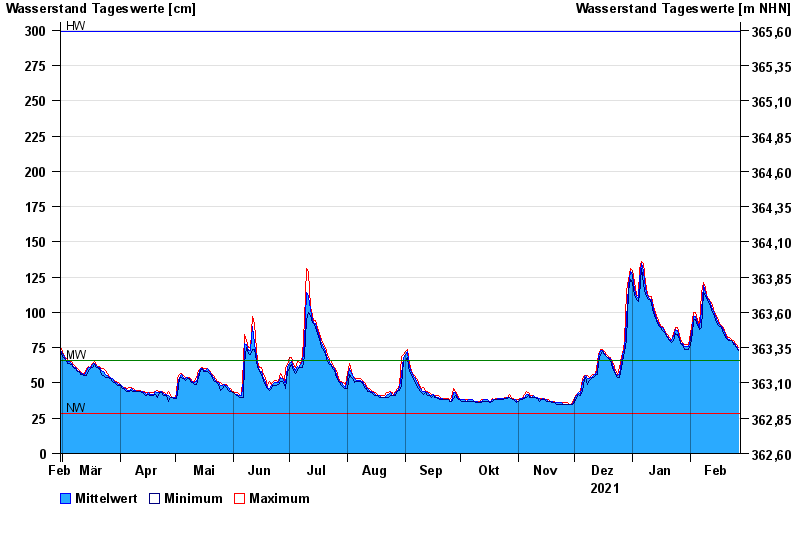
| Datum | Mittelwert [cm] | Maximum [cm] | Minimum [cm] |
|---|---|---|---|
| 27.02.2022 | 74 | 75 | 73 |
| 26.02.2022 | 76 | 77 | 75 |
| 25.02.2022 | 78 | 79 | 77 |
| 24.02.2022 | 79 | 80 | 77 |
| 23.02.2022 | 80 | 81 | 80 |
| 22.02.2022 | 81 | 82 | 80 |
| 21.02.2022 | 81 | 82 | 81 |
© Bayerisches Landesamt für Umwelt 2024