
- Startseite >
- Flüsse >
- Wasserstand >
- Obere Donau >
- Beilngries oberh. der Sulz >
- Jahresgrafik

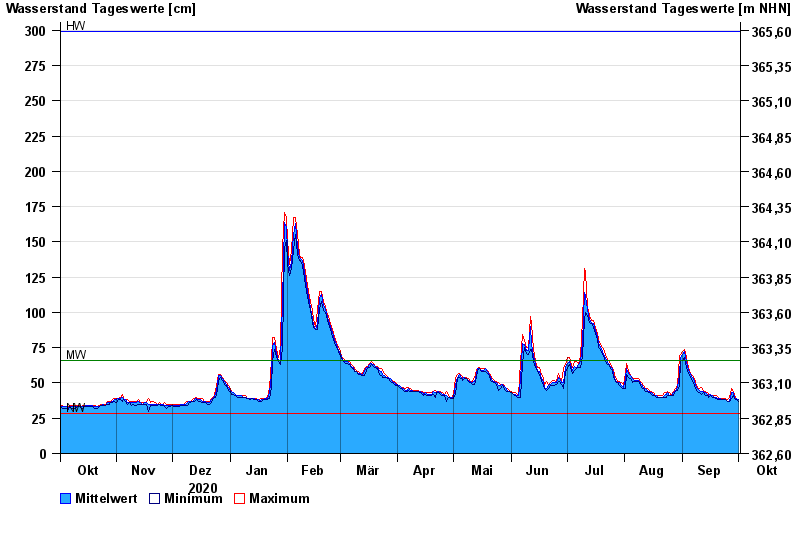
Jahresgrafik Beilngries oberh. der Sulz / Altmühl
Wasserstand vom 02.10.2020 bis zum 01.10.2021
| Datum | Mittelwert [cm] | Maximum [cm] | Minimum [cm] |
|---|---|---|---|
| 01.10.2021 | 38 | 38 | 37 |
| 30.09.2021 | 39 | 39 | 38 |
| 29.09.2021 | 40 | 41 | 39 |
| 28.09.2021 | 43 | 44 | 41 |
| 27.09.2021 | 43 | 46 | 39 |
| 26.09.2021 | 37 | 40 | 37 |
| 25.09.2021 | 37 | 38 | 37 |
© Bayerisches Landesamt für Umwelt 2024