
- Startseite >
- Flüsse >
- Wasserstand >
- Isar >
- Weilheim >
- Jahresgrafik

Jahresgrafik Weilheim / Ammer
Wasserstand vom 25.01.2021 bis zum 24.01.2022
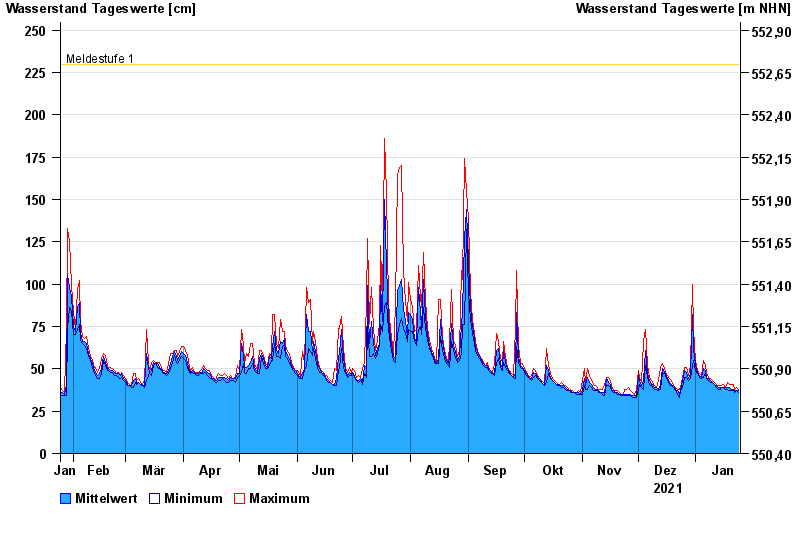
- Meldestufe 1 230 cm
- Meldestufe 3 370 cm
- Meldestufe 4 420 cm
- Hochwassergefahrenfläche HQ100 490 cm
| Datum | Mittelwert [cm] | Maximum [cm] | Minimum [cm] |
|---|---|---|---|
| 24.01.2022 | 37 | 38 | 36 |
| 23.01.2022 | 37 | 39 | 37 |
| 22.01.2022 | 37 | 38 | 36 |
| 21.01.2022 | 38 | 41 | 37 |
| 20.01.2022 | 38 | 41 | 37 |
| 19.01.2022 | 39 | 41 | 37 |
| 18.01.2022 | 39 | 42 | 38 |
© Bayerisches Landesamt für Umwelt 2024