
- Startseite >
- Flüsse >
- Wasserstand >
- Isar >
- Wasserburg >
- Jahresgrafik

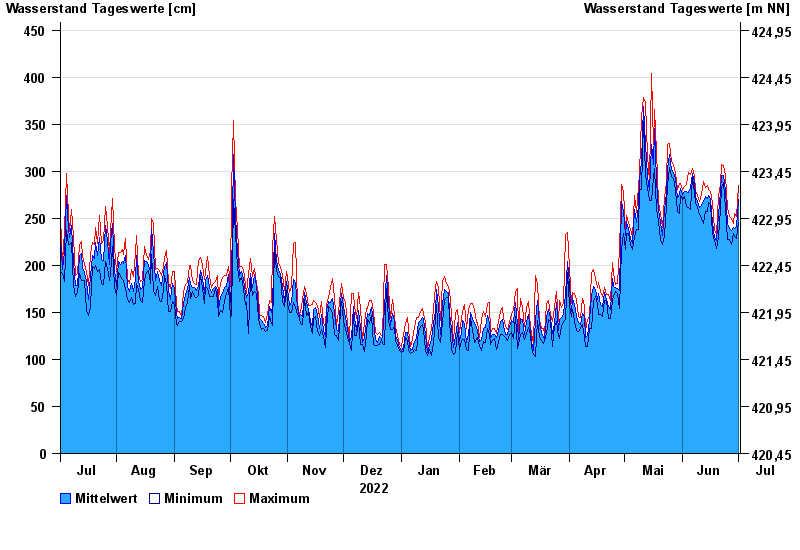
Jahresgrafik Wasserburg / Inn
Wasserstand vom 02.07.2022 bis zum 01.07.2023
- 23.08.2005 Wasserstand: 719 cm
- 07.08.1985 Wasserstand: 670 cm
- 21.05.1999 Wasserstand: 638 cm
- 02.06.2013 Wasserstand: 630 cm
- 20.07.1981 Wasserstand: 615 cm
| Datum | Mittelwert [cm] | Maximum [cm] | Minimum [cm] |
|---|---|---|---|
| 01.07.2023 | 270 | 285 | 246 |
| 30.06.2023 | 241 | 252 | 229 |
| 29.06.2023 | 239 | 255 | 231 |
| 28.06.2023 | 240 | 245 | 234 |
| 27.06.2023 | 237 | 250 | 222 |
| 26.06.2023 | 239 | 252 | 227 |
| 25.06.2023 | 244 | 260 | 227 |
© Bayerisches Landesamt für Umwelt 2024