
- Startseite >
- Flüsse >
- Wasserstand >
- Isar >
- Siegsdorf >
- Jahresgrafik

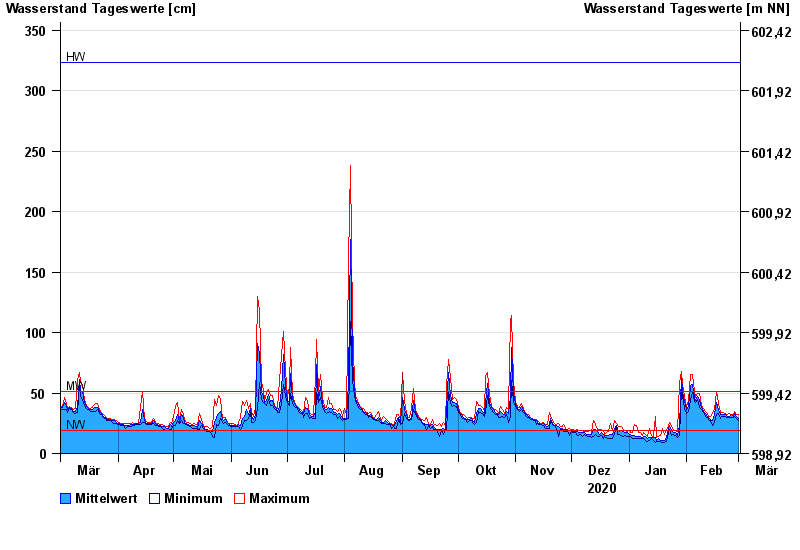
Jahresgrafik Siegsdorf / Weiße Traun
Wasserstand vom 01.03.2020 bis zum 01.03.2021
| Datum | Mittelwert [cm] | Maximum [cm] | Minimum [cm] |
|---|---|---|---|
| 01.03.2021 | 29 | 32 | 27 |
| 28.02.2021 | 31 | 32 | 29 |
| 27.02.2021 | 33 | 35 | 31 |
| 26.02.2021 | 31 | 32 | 30 |
| 25.02.2021 | 32 | 32 | 30 |
| 24.02.2021 | 31 | 33 | 30 |
| 23.02.2021 | 31 | 32 | 30 |
© Bayerisches Landesamt für Umwelt 2024